Cancer
The bubble chart below shows the number of tumours diagnosed by tumour site in 2014 for males and females in each of the West Sussex CCGs and England overall. The size of the bubbles represent the relative number of diagnoses of that tumour site. You can change the area of interest and look at number of tumours for females by changing the selections in the top right of the chart.
The purpose of this section is to collate information relating to incidence, mortality, treatment and survival for all cancers and selected tumours in NHS Coastal West Sussex CCG. Information for other CCGs can be found by navigating to the relevant CCG pages.
Data are presented in five sections and you can use the links below to find out more.
- Cancer prevalence
- Cancer incidence (including trends and projections)
- Cancer mortality (including trends and projections)
- Cancer screening
- Diagnosis, treatment, and survival
Cancer prevalence
In the 2015/16 financial year, 3.4% (17,246 patients) of the GP registered population in NHS Coastal West Sussex CCG were living with a diagnosis of cancer. This is an increase of 9.2% of the number of people on the disease register in the CCG compared to 2014/15.
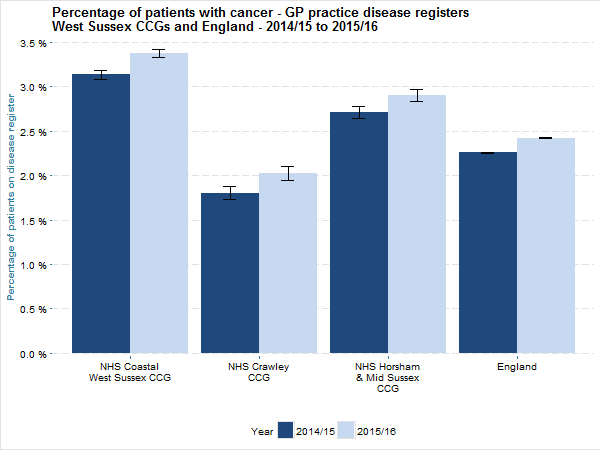
The proportion of patients living with cancer in the CCG was higher than in England overall in 2015/16 although the percentage increase in England between 2014/15 and 2015/16 was 8%.
Cancer incidence
This section outlines the incidence (new cases) of cancer identified in the CCG compared to England overall. Data are pooled for three year periods due to the small number of cases for some cancer sites, and to account for the natural variation across individual years.
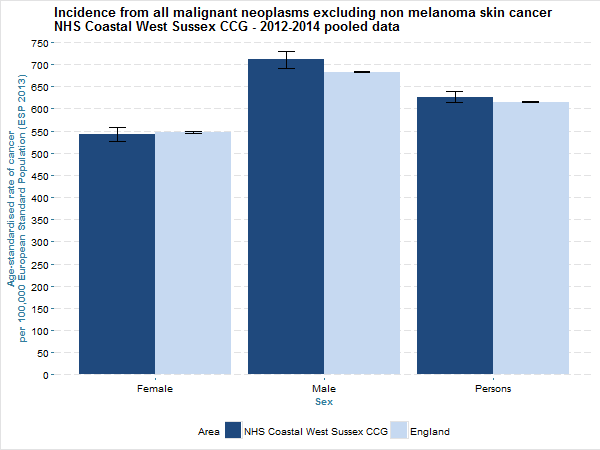
Between 2012 and 2014, there were 10,502 newly diagnosed malignant tumours (an average of 3,501 new cases annually) among patients in NHS Coastal West Sussex CCG. The directly age-standardised rate (per year) for the CCG using pooled data for 2012-14 was 627 new cases per year per 100,000 European Standard Population (ESP 2013). This is similar to the rate for England overall.
The figure below shows the directly age-standardised incidence rate (per year, per 100,000 European Standard Population) of malignant neoplasms diagnosed between 2012 and 2014 in NHS Coastal West Sussex CCG and England. The figure shows that the standardised incidence rate for females in the CCG (542 new cases per year, per 100,000), is similar to females nationally (547 new cases per year, per 100,000). However, the age-standardised rate for males in the CCG (711 new cases per year, per 100,000), is higher than males nationally (683 new cases per year, per 100,000).
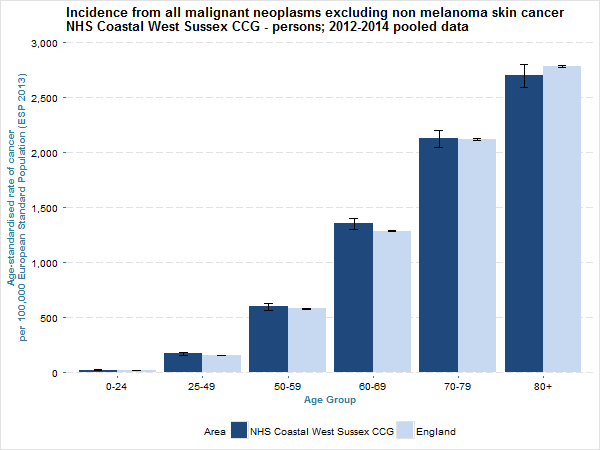
The table below shows the number of tumours diagnosed between 2012 and 2014 in NHS Coastal West Sussex CCG and England. The age standardised rate per 100,000 European Standard Population (2013) and confidence intervals are given to enable comparison across ages and between areas.
Incidence of cancer diagnosed in NHS Coastal West Sussex CCG; pooled data 2012-2014
| Area | Age Group | Number of Tumours | Age Standardised Rate (per 100,000 ESP 2013) | 95 % Confidence interval |
|---|---|---|---|---|
| NHS Coastal West Sussex CCG | 0-24 | 88 | 24 | 18-29 |
| NHS Coastal West Sussex CCG | 25-49 | 729 | 172 | 159-185 |
| NHS Coastal West Sussex CCG | 50-59 | 1,138 | 598 | 563-633 |
| NHS Coastal West Sussex CCG | 60-69 | 2,647 | 1,352 | 1,300-1,404 |
| NHS Coastal West Sussex CCG | 70-79 | 3,070 | 2,126 | 2,050-2,202 |
| NHS Coastal West Sussex CCG | 80+ | 2,830 | 2,698 | 2,595-2,801 |
| England | 0-24 | 9,842 | 20 | 20-20 |
| England | 25-49 | 87,447 | 158 | 157-159 |
| England | 50-59 | 117,555 | 581 | 578-584 |
| England | 60-69 | 225,157 | 1,287 | 1,281-1,292 |
| England | 70-79 | 242,127 | 2,122 | 2,114-2,131 |
| England | 80+ | 200,729 | 2,782 | 2,769-2,794 |
The chart below shows the age standardised rate of new cases per year per 100,000 European Standard Population (2013) for NHS Coastal West Sussex CCG and England in 2012-14 by age group.
Trends in cancer incidence
The chart below shows the long term trends in incidence of all malignant tumours, excluding non melanoma skin cancer, for the population of NHS Coastal West Sussex between 2001-03 and 2012-14 compared to England. The colour of the dots represents whether the age-standardised rate in NHS Coastal West Sussex CCG was significantly lower, similar to, or higher than the incidence nationally.
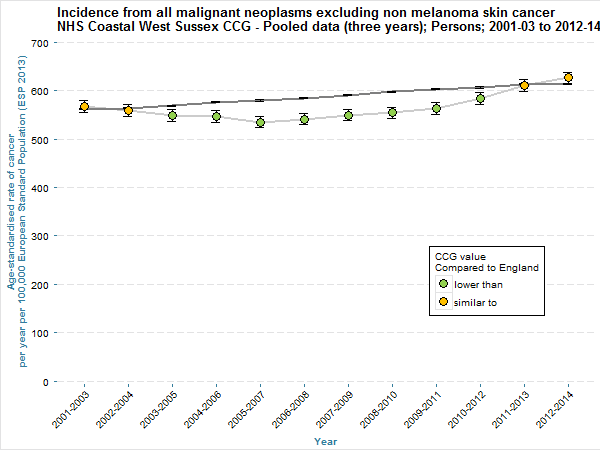
The trend chart shows that the incidence rate of diagnosed cancer has been mostly lower than the rate for England although it has increased in recent years. In the last two time periods (2011-13 and 2012-14) the rate was similar to the rate in England. If this trend continues, the rate of incidence per year per 100,000 population may be significantly higher in the CCG compared to England.
Indeed, among males, the 2012-14 age-standardised rate of cancer incidence in NHS Coastal West Sussex CCG (711 new cases per year per 100,000 European Standard Population (2013); 95% CI: 692-730 new cases) was significantly higher than males in England (683 new cases per year per 100,000 European Standard Population (2013); 95% CI: 681-685 new cases). The table below shows the number of tumours diagnosed and age-standardised rates for males and females in the CCG for each time period.
Incidence from all malignant cancer, excluding non-melanoma skin cancer; among males and females in NHS Coastal West Sussex CCG and England; pooled data (three years); 2001-03 to 2012-14
Cancer incidence projections
The table below contains the estimated incidence projections for malignant cancer in NHS Coastal West Sussex CCG up to 2030 using age-specific incidence rates from Cancer research UK, population projections at CCG level from the Office for National Statistics and incidence data from the National Cancer Intelligence Network.
Age specific incidence rates (for 5 year age bands) for the UK were applied to the 2014 based NHS Coastal West Sussex CCG population projections* for years 2014, 2016, 2021, 2026 and 2030. This gives an estimated number of diagnoses for each year and a percentage increase from the 2014 figures. The percentage increase is applied to the actual estimated incidence figures (using the average of the 2012 to 2014 incidence). The projections assume that age-specific cancer incidence rates will remain at the rate as at 2012-14. It is expected, however, that incidence rates will rise between now and 2030 due to changes in treatment, screening behaviours and diagnostic testing as well as recording of cancer statistics and so these projections should be treated with caution.
Incidence of malignant cancers in NHS Coastal West Sussex CCG; projections 2014-2030
| Year | Estimated incidence | Estimates adjusted for observed incidence (2012-14 average) | Percentage increase from 2014 estimates | Additional cases (projections) |
|---|---|---|---|---|
| 2014 | 3,572 | 3,501 | - | - |
| 2016 | 3,697 | 3,623 | 3.5% | 122 |
| 2021 | 4,072 | 3,990 | 14% | 490 |
| 2026 | 4,505 | 4,415 | 26.1% | 915 |
| 2030 | 4,858 | 4,761 | 36% | 1,260 |
The projections used in these analyses are subnational population projections (SNPP) produced by the Office for National Statistics in 2016, and are based on the 2014 mid-year population estimates. As a result, these estimates are based on the old CCG boundary where four lower-layer super output areas (LSOAs) were formerly assigned to NHS Guildford and Waverley CCG. This equates to a deficit of around 7,000 residents. As such, the projections for NHS Coastal West Sussex CCG (particularly for later years) are likely to underestimate the projected population size of the CCG area when the new boundary is taken into account.
The analysis indicates that in 2016, there were an estimated 122 additional cases per year compared to the 2012-14 average, and by 2030 there will be an additional 1,260 cases per year compared to the average number of new cases for 2012-14.
Cancer mortality
Data presented on cancer related mortality are taken from the Office for National Statistics (ONS) Mortality Extract provided to the National Cancer Registration Service (National Cancer Intelligence Network). The ONS rules around coding death certificates are used to determine which tumour is the cause of death in these cases. Rates are standardised according to an approximate 2013 European Standard Population, in order to allow for comparisons between different localities (which may have different age structures) or over time (where the age structure might change).
Between 2012 and 2014, there were 4,830 deaths (an average of 1,610 deaths annually) among patients in NHS Coastal West Sussex CCG attributed to malignant neoplasms (excluding non melanoma skin cancer). The directly age-standardised rate (per year) for the CCG using pooled data for 2012-14 was 273 deaths per year per 100,000 European Standard Population (ESP 2013). This is lower than the rate for England overall.
The figure below shows the directly age-standardised mortality rate (per year, per 100,000 European Standard Population) attributed to malignant neoplasms in NHS Coastal West Sussex CCG and England. The figure shows that the standardised incidence rate for females in the CCG (225 deaths per year, per 100,000), is similar to females nationally (232 deaths per year, per 100,000). In addition, the age-standardised rate for males in the CCG (320 annual deaths per 100,000), is similar to males nationally (332 deaths per year, per 100,000).
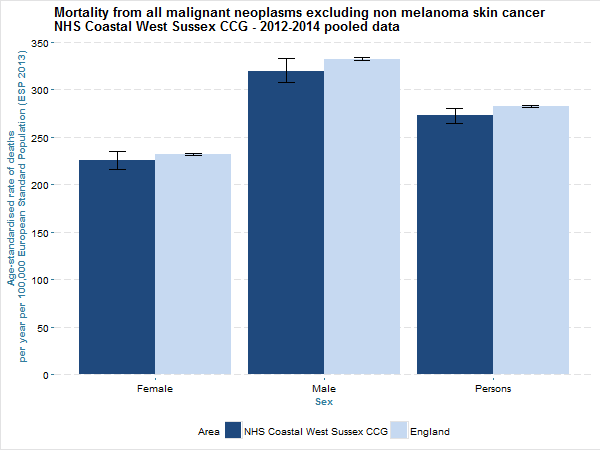
The table below shows the number of deaths attributed to malignant cancer between 2012 and 2014 in NHS Coastal West Sussex CCG and England. The age standardised rate per 100,000 European Standard Population (2013) and confidence intervals are given to enable comparison across ages and between areas.
Mortality from cancer; patients in NHS Coastal West Sussex CCG; pooled data 2012-2014
| Area | Age Group | Number of deaths | Age Standardised Rate (per 100,000 ESP 2013) | 95 % Confidence Interval |
|---|---|---|---|---|
| NHS Coastal West Sussex CCG | 0-24 | 12 | 3 | 1-5 |
| England | 0-24 | 1,309 | 3 | 3-3 |
| NHS Coastal West Sussex CCG | 25-49 | 139 | 33 | 27-39 |
| England | 25-49 | 15,965 | 29 | 28-29 |
| NHS Coastal West Sussex CCG | 50-59 | 339 | 179 | 159-198 |
| England | 50-59 | 33,657 | 167 | 165-168 |
| NHS Coastal West Sussex CCG | 60-69 | 933 | 477 | 445-507 |
| England | 60-69 | 81,152 | 464 | 461-467 |
| NHS Coastal West Sussex CCG | 70-79 | 1,362 | 939 | 888-989 |
| England | 70-79 | 116,303 | 1,017 | 1,012-1,023 |
| NHS Coastal West Sussex CCG | 80+ | 2,045 | 1,945 | 1,858-2,033 |
| England | 80+ | 150,312 | 2,092 | 2,081-2,103 |
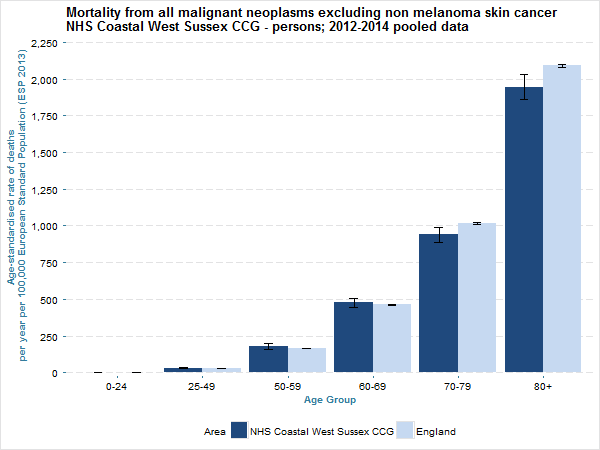
The chart below shows the age standardised rate of deaths per year per 100,000 European Standard Population (2013) for NHS Coastal West Sussex CCG and England in 2012-14 by age group.
Trends in cancer mortality
The chart below shows the long term trends in mortality attributed to malignant tumours, excluding non melanoma skin cancer, for the population of NHS Coastal West Sussex between 2001-03 and 2012-14 compared to England. The colour of the dots represents whether the age-standardised rate in NHS Coastal West Sussex CCG was significantly lower, similar to, or higher than the incidence nationally.
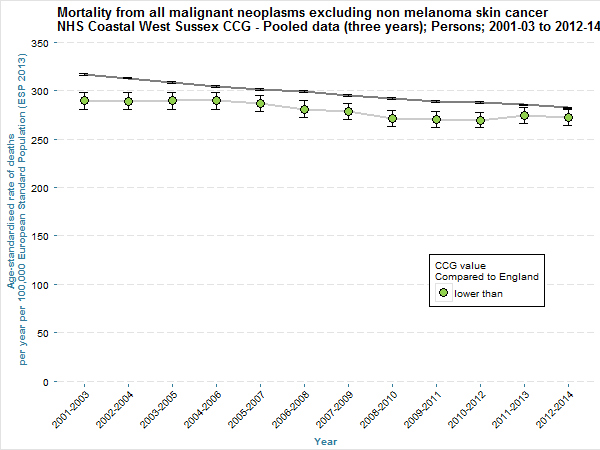
The chart shows that age-standardised mortality is consistently lower than the rate in England over all time periods available. However, it also shows that in recent years, the gap between the CCG and England is closing. For males, in the latest period (2012-14) the mortality rate in the CCG (320 deaths per 100,000 ESP 2013 (95% CI: 307-333 deaths) was similar to England (332 deaths per 100,000 ESP 2013 (95% CI: 330-334 deaths). Among females, the age-standardised mortality rate in the CCG has been similar to England for the last two periods of data (2011-13 and 2012-14). The age-standardised mortality rate by sex and year (pooled three year data) for NHS Coastal West Sussex CCG and England are given in the table below.
Mortality from all malignant cancer, excluding non-melanoma skin cancer; among males and females in NHS Coastal West Sussex CCG and England; pooled data (three years); 2001-03 to 2012-14
Cancer mortality projections
The table below contains the estimated mortality projections for malignant cancer in NHS Coastal West Sussex CCG up to 2030 using age-specific mortality rates from Cancer research UK, population projections at CCG level from the Office for National Statistics and mortality data from the National Cancer Intelligence Network.
Age specific mortality rates (for 5 year age bands) for the UK were applied to the 2014 based NHS Coastal West Sussex CCG population projections* for years 2014, 2016, 2021, 2026 and 2030. This gives an estimated number of deaths for each year and a percentage increase from the 2014 figures. The percentage increase is applied to the actual mortality figures (using the average of the 2012 to 2014 number of deaths). The projections assume that age-specific cancer mortality rates will remain at the rate as at 2012-14. It is expected, however, that incidence rates will rise between now and 2030 due to changes in treatment, screening behaviours and diagnostic testing as well as recording of cancer statistics, which may have an impact on the mortality experienced and so these projections should be treated with caution.
Mortality from malignant cancers in NHS Coastal West Sussex CCG; projections 2014-2030
| Year | Estimated number of deaths based on national age-specific rates and 2014 subnational (CCG) projections | Estimates adjusted for observed mortality (2012-14 average) | Percentage increase from 2014 estimates | Projected number of additional deaths (per year) based on observed mortality |
|---|---|---|---|---|
| 2014 | 1,766 | 1,610 | - | - |
| 2016 | 1,834 | 1,672 | 3.8% | 62 |
| 2021 | 2,054 | 1,873 | 16.3% | 263 |
| 2026 | 2,330 | 2,124 | 32% | 514 |
| 2030 | 2,577 | 2,349 | 45.9% | 739 |
The projections used in this analyses are subnational population projections (SNPP) produced by the Office for National Statistics in 2016, and are based on the 2014 mid-year population estimates. As a result, these estimates are based on the old CCG boundary where four lower-layer super output areas (LSOAs) were formerly assigned to NHS Guildford and Waverley CCG. This equates to a deficit of around 7,000 residents. As such, the projections for NHS Coastal West Sussex CCG (particularly for later years) are likely to underestimate the projected population size of the CCG area when the new boundary is taken into account.
The analysis indicates that in 2016, there were an estimated 62 additional deaths per year compared to the 2012-14 average, and by 2030 there will be an additional 739 deaths per year attributed to cancer compared to the average number of new cases for 2012-14.
Cancer screening
Information on cancer screening will be added soon, please check back later.
Diagnosis, treatment, and survival
Information on diagnosis, treatment, and survival will be added soon, please check back later.
References
The data presented on this page are collated from four main sources:
- Public Health England: Cancer Services Dashboard
- Public Health England and NHS England: Cancer Dashboard
- Office for National Statistics: Cancer Survival Data
- Quality Health (on behalf of NHS England): Cancer Patient Experience Survey
Please note: we are currently updating the West Sussex JSNA site so please check back soon for updates.