Births and Maternity
Live Births
In 2013, there were approximately 4,610 live births to mothers whose usual residence is within NHS Coastal West Sussex CCG.
Table 1: Live Births to Mothers Living in NHS Coastal West Sussex CCG (2011-13)
| Localities | 2011 | 2012 | 2013 | Total 2011-13 |
|---|---|---|---|---|
| Adur | 645 | 715 | 710 | 2,070 |
| Arun | 640 | 630 | 560 | 1,830 |
| Chanctonbury | 375 | 390 | 375 | 1,140 |
| Chichester | 1,110 | 1,055 | 945 | 3,115 |
| Cissbury (Worthing) | 1,285 | 1,195 | 1,140 | 3,625 |
| Regis | 875 | 940 | 880 | 2,695 |
| CCG | 4,930 | 4,930 | 4,610 | 14,470 |
Mothers Under the Age of 20
Young mothers (first time mothers under the age of 20) are a target group for the work of the Family Nurse Partnership (FNP). Not all hospital maternity records used a “flag” for first time mothers, therefore the information provided relates to all mothers under the age of 20. The majority of these women will be first time mothers. Of the total number of live births in Coastal West Sussex CCG (4,612 live births), 4.6% (212 live births) were to women under the age of 20 years.
Table 2: Proportion of Live Births to Mothers Aged Under 20yrs in NHS Coastal West Sussex CCG (2011-13)
| Localities | 2011 | 2012 | 2013 | Total 2011-13 |
|---|---|---|---|---|
| Adur | 4.2% | 4.6% | 3.4% | 4.1% |
| Arun | 7.2% | 5.1% | 4.6% | 5.7% |
| Chanctonbury | 2.7% | 3.1% | 4.3% | 3.3% |
| Chichester | 4.8% | 4.5% | 5.5% | 4.9% |
| Cissbury (Worthing) | 4.0% | 4.4% | 4.0% | 4.1% |
| Regis | 5.9% | 4.6% | 5.4% | 5.3% |
| CCG | 4.8% | 4.5% | 4.6% | 4.6% |
Low Birth Weight
In 2013, approximately 310 live births in NHS Coastal West Sussex CCG were recorded to be of low birth weight (less than 2.5kg); this accounts for 6.7% of all live births in the CCG.
Table 3: The proportion of live births that are of low birth weight (<2.5kgs) in NHS Coastal West Sussex CCG (2011-13)
| Localities | 2011 | 2012 | 2013 |
|---|---|---|---|
| Adur | 5.1% | 4.7% | 6.1% |
| Arun | 5.9% | 6.2% | 6.8% |
| Chanctonbury | 5.1% | 6.6% | 8.3% |
| Chichester | 5.8% | 7.1% | 7.6% |
| Cissbury (Worthing) | 6.2% | 7.0% | 6.1% |
| Regis | 5.8% | 7.0% | 6.2% |
| CCG | 5.8% | 6.6% | 6.7% |
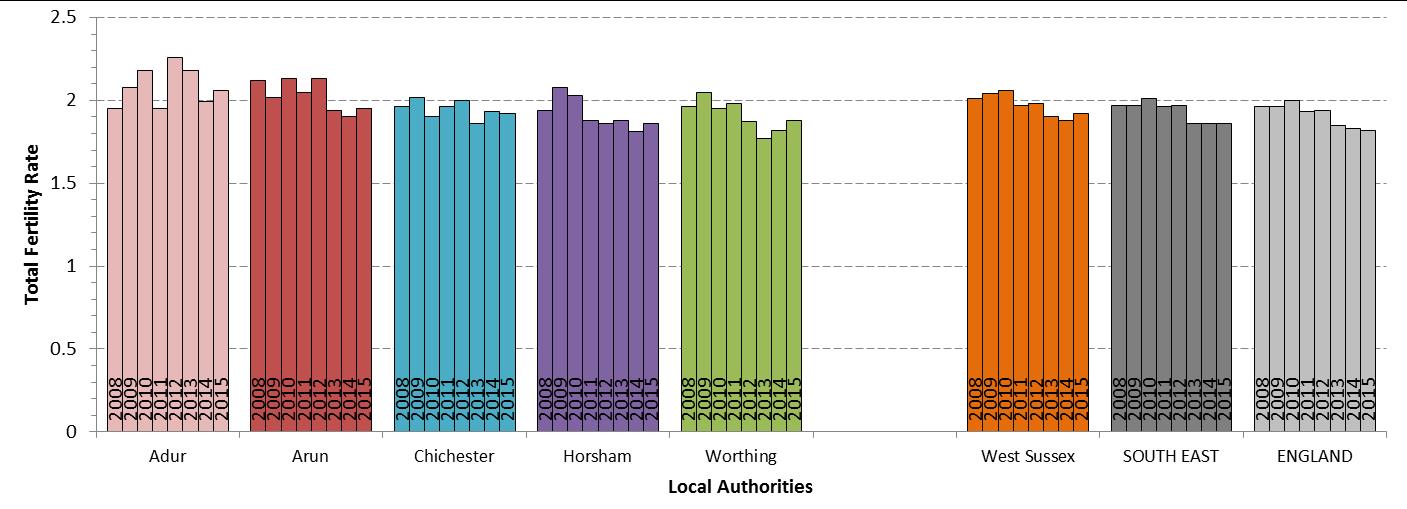
Fertility
The total fertility rate (TFR) is the average number of children that a group of women would each bear if they experience the age-specific fertility rates of the calendar year in question throughout their childbearing lifespan. It provides a snapshot of the level of fertility in a particular year and does not necessarily represent the average number of children that a group of women will have over their lifetime.
Birth statistics for England and Wales are based on the details collected when births are registered. By law, births should be registered within 42 days.
The information in the chart below relates to data at local authority district level. Horsham local authority spans both NHS Horsham and Mid Sussex CCG and NHS Coastal West Sussex CCG. As such, the data presented here represents the whole of the Horsham local authority, not just that covered by NHS Coastal West Sussex CCG. It is based on the resident population and not on GP registered population.
Under-18 Conceptions
Conception data combine information from registrations of births and notifications of legal abortions occurring in England and Wales for women who are usually resident there. Conception statistics include pregnancies that result in:
- One or more live, or stillbirths (a maternity)
- A legal abortion under the Abortion Act 1967
They do not include miscarriages or illegal abortions.
The date of conception is estimated using recorded gestation for abortions and stillbirths, and assuming 38 weeks gestation for live births. A woman’s age at conception is calculated as the number of complete years between her date of birth and the date she conceived.
This information is only available at local authority district level. Note that Horsham local authority spans both NHS Horsham and Mid Sussex CCG and NHS Coastal West Sussex CCG.