Deprivation
This section shows a number of measures of deprivation across NHS Coastal West Sussex CCG. The most recently available deprivation data are from the 2015 English Indices of Deprivation and this shows relative deprivation at small areas (LSOAs). Data on household deprivation comes from the 2011 census. Data on child poverty (the number and proportion of under 16 year olds living in low income households) is also given here.
Indices of Deprivation 2015
The Indices of Deprivation is an area-based measure of relative levels of deprivation in small areas, (Lower Super Output Areas (LSOAs), which contain approximately 1,500 people). It can be used to compare the deprivation across different areas, identify the most deprived areas within a larger geography (for example in the CCG), and to examine which domains of deprivation are more or less prominent in an area. The Indices cannot be used to quantify how deprived an area is (nor can it say by how much one area is more deprived than another), and there are different indices of deprivation for Wales, Scotland and Northern Ireland (so comparisons cannot be made across countries).
The indices are published by the Department for Communities and Local Government every 3-4 years and are widely used, notably in funding allocations and targeting. The most recent update is the ID2015, released in September 2015 using data mostly from 2012/13. ID2015 is made up of seven domains of deprivation, although each domain is not given equal weighting. From these, an overall score of small area deprivation is calculated; these are then ranked from most deprived (1) to least deprived (32,844). It is important to note that the indices measure deprivation and not affluence (the least deprived area may not necessarily be the most affluent).
Domains contributing1 to the overall Index of multiple deprivation:
- Income (22.5%)
- Employment (22.5%)
- Health Deprivation and Disability (13.5%)
- Education, Skills and Training (13.5%)
- Crime (9.3%)
- Barriers to Housing and Services (9.3%)
- Living Environment (9.3%)
The map shows the relative deprivation deciles (using national rankings) for LSOAs in NHS Coastal West Sussex CCG. The most deprived areas (those in the most deprived 10% of LSOAs in England) are shaded dark blue. As can be seen from the map, NHS Coastal West Sussex CCG contains some of the most deprived neighbourhoods in the country (these fall within the River, Courtwick with Toddington and Bersted wards).
If you cannot see the map, please click on this link and use the back button of your browser to return to this page.
Indices of multiple deprivation at GP practice level
GP practices do not have established geographical boundaries (e.g. people residing in one area may be registered to GP practices outside of their local area and more than one GP practice may operate in a single area). However, using the January 2016 release of residential location of GP registered patients, it is possible to create a deprivation score for each GP practice “reach”.
The GP Practice deprivation score is the registered population (as at 31st December 2015) weighted by ID2015 score, as a proportion of the total population registered to the GP. This is calculated by taking the deprivation score for every LSOA where a GP has registrations multiplied by the number of registrations for the GP in that LSOA and dividing this total by the number of people registered to the GP.
The figure below shows GP practices within each CCG in West Sussex by their national decile group (practices in dark blue are estimated to have the most deprived populations in England whereas those in orange are the least deprived).
In NHS Coastal West Sussex CCG, one practice (Bognor Medical Centre) is estimated to have a population in the ID2015 3rd most deprived decile. In addition, one practice falls within the 4th most deprived decile (Fitzalan practice). Conversely four practices within NHS Coastal West Sussex CCG are amongst the 10% least deprived in England (Barn Surgery, Steyning Health Centre, Southbourne Surgery and Loxwood Surgery).
The table below shows the number of practices in each deprivation decile for NHS Coastal West Sussex CCG, and other CCGs in West Sussex.
| Deciles | NHS Crawley CCG | NHS Coastal West Sussex CCG | NHS Horsham and Mid Sussex CCG | West Sussex GPs |
|---|---|---|---|---|
| 10% most deprived GP practices | 0 | 0 | 0 | 0 |
| 2nd decile | 0 | 0 | 0 | 0 |
| 3rd decile | 0 | 1 | 0 | 1 |
| 4th decile | 1 | 1 | 0 | 2 |
| 5th decile | 1 | 7 | 0 | 8 |
| 6th decile | 5 | 9 | 0 | 14 |
| 7th decile | 0 | 5 | 0 | 5 |
| 8th decile | 4 | 13 | 0 | 17 |
| 9th decile | 0 | 13 | 2 | 15 |
| 10% least deprived GP practices | 1 | 4 | 21 | 26 |
| Total number of practices | 12 | 53 | 23 | 88 |
Income Deprivation
The Income Deprivation Domain measures the proportion of the population experiencing deprivation relating to low income. The definition of low income used includes both those people that are out-of-work, and those that are in work but who have low earnings (and who satisfy the respective means tests). The score for this domain is expressed as a proportion of the total population of the Lower-layer Super Output Area as at mid-2012 (from the Office for National Statistics) less the prison population (from the Ministry of Justice).
The map below shows the relative income deprivation deciles (using national rankings) for LSOAs in NHS Coastal West Sussex CCG. The most deprived areas (those in the most deprived 10% of LSOAs in England) are shaded dark blue. You can also change the view to show the relative deprivation deciles within the CCG itself (to identify most and least deprived small areas in the CCG) by clicking on the right hand side of the map.
If you cannot see the map, please click on this link and use the back button of your browser to return to this page.
In addition to the overall income deprivation score, two supplementary indices are available; the income deprivation affecting children index and the income deprivation affecting older people index.
Income Deprivation Affecting Children
The Income Deprivation Affecting Children Index is the proportion of all children aged 0 to 15 living in income deprived families. Income deprived families are defined as families that either receive Income Support or income-based Jobseekers Allowance or income-based Employment and Support Allowance or Pension Credit (Guarantee) or families not in receipt of these benefits but in receipt of Working Tax Credit or Child Tax Credit with an equivalised income (excluding housing benefit) below 60 per cent of the national median before housing costs.
The map below shows the relative income deprivation affecting children deciles (using national rankings) for LSOAs in NHS Coastal West Sussex CCG.
If you cannot see the map, please click on this link and use the back button of your browser to return to this page.
Income Deprivation Affecting Older People
The Income Deprivation Affecting Older People Index is the proportion of all those aged 60 or over who experience income deprivation. This includes adults aged 60 or over receiving Income Support or income-based Jobseekers Allowance or income-based Employment and Support Allowance or Pension Credit (Guarantee).
The map below shows the relative income deprivation affecting older people deciles (using national rankings) for LSOAs in NHS Coastal West Sussex CCG.
If you cannot see the map, please click on this link and use the back button of your browser to return to this page.
Employment Deprivation
The Employment Deprivation Domain measures the proportion of the working-age population in an area involuntarily excluded from the labour market. This includes people who would like to work but are unable to do so due to unemployment, sickness or disability, or caring responsibilities.
The Employment Deprivation Domain numerator was expressed as a proportion of the Employment Deprivation Domain denominator to form the Employment Deprivation Domain score. The score represents the proportion of the working-age population experiencing employment deprivation. The denominator is the working-age population (women aged 18 to 59 and men aged 18 to 64), derived from 2012 and 2013 mid-year population estimates (from the Office for National Statistics), with the prison population (from the Ministry of Justice) subtracted. In order to provide a time point which closely matches the numerator, 2012 and 2013 mid-year population estimates were used, with a weight of 0.75 applied to the 2012 count and a weight of 0.25 applied to the 2013 count.
The map below shows the relative employment deprivation deciles (using national rankings) for LSOAs in NHS Coastal West Sussex CCG. The most deprived areas (those in the most deprived 10% of LSOAs in England) are shaded dark blue. You can also change the view to show the relative deprivation deciles within the CCG itself (to identify most and least deprived small areas in the CCG) by clicking on the right hand side of the map.
If you cannot see the map, please click on this link and use the back button of your browser to return to this page.
Education Deprivation
The Education, Skills and Training Domain measures the lack of attainment and skills in the local population. The scores for two subdomains (education deprivation affecting children and education deprivation affecting adults) are combined to create an overall score of the education deprivation affecting the local area.
The map below shows the relative education deprivation deciles (using national rankings) for LSOAs in NHS Coastal West Sussex CCG. The most deprived areas (those in the most deprived 10% of LSOAs in England) are shaded dark blue. You can also change the view to show the relative deprivation deciles within the CCG itself (to identify most and least deprived small areas in the CCG) by clicking on the right hand side of the map.
If you cannot see the map, please click on this link and use the back button of your browser to return to this page.
Health Deprivation
The Health Deprivation and Disability Domain measures the risk of premature death and the impairment of quality of life through poor physical or mental health. The domain measures morbidity, disability and premature mortality but not aspects of behaviour or environment that may be predictive of future health deprivation.
The map below shows the relative health deprivation deciles (using national rankings) for LSOAs in NHS Coastal West Sussex CCG. The most deprived areas (those in the most deprived 10% of LSOAs in England) are shaded dark blue. You can also change the view to show the relative deprivation deciles within the CCG itself (to identify most and least deprived small areas in the CCG) by clicking on the right hand side of the map.
If you cannot see the map, please click on this link and use the back button of your browser to return to this page.
Crime Deprivation
The Crime Domain measures the risk of personal and material victimisation at local level. Indicators include rates (per 1,000 at risk population) for violence, burglary, theft and criminal damage.
The map below shows the relative crime deprivation deciles (using national rankings) for LSOAs in NHS Coastal West Sussex CCG. The most deprived areas (those in the most deprived 10% of LSOAs in England) are shaded dark blue. You can also change the view to show the relative deprivation deciles within the CCG itself (to identify most and least deprived small areas in the CCG) by clicking on the right hand side of the map.
If you cannot see the map, please click on this link and use the back button of your browser to return to this page.
Barriers to Housing Deprivation
The Barriers to Housing and Services Domain measures the physical and financial accessibility of housing and local services. The indicators fall into two subdomains: ‘geographical barriers’, which relate to the physical proximity of local services, and ‘wider barriers’ which includes issues relating to access to housing such as affordability. Indicators include road distance to schools, shops and primary care as well as household overcrowding, affordability of housing and homelessness.
The map below shows the relative barriers to housing and services deprivation deciles (using national rankings) for LSOAs in NHS Coastal West Sussex CCG. The most deprived areas (those in the most deprived 10% of LSOAs in England) are shaded dark blue. You can also change the view to show the relative deprivation deciles within the CCG itself (to identify most and least deprived small areas in the CCG) by clicking on the right hand side of the map.
If you cannot see the map, please click on this link and use the back button of your browser to return to this page.
Living Environment Deprivation
The Living Environment Deprivation Domain measures the quality of the local environment. The indicators fall into two sub-domains. The ‘indoors’ living environment measures the quality of housing; while the ‘outdoors’ living environment contains measures of air quality and road traffic accidents. You can also change the view to show the relative deprivation deciles within the CCG itself (to identify most and least deprived small areas in the CCG) by clicking on the right hand side of the map.
The map below shows the relative living environment deprivation deciles (using national rankings) for LSOAs in NHS Coastal West Sussex CCG. The most deprived areas (those in the most deprived 10% of LSOAs in England) are shaded dark blue.
If you cannot see the map, please click on this link and use the back button of your browser to return to this page.
Deprivation from the 2011 Census
This section contains data on small area deprivation using the 2011 Census.
The 2011 census collected a wide variety of information which can, in combination, be used to identify some of the characteristics common to deprived households. Census data are available at smaller geographies than the ID2015, down to output area level (covering approximately 100 households); this is useful in West Sussex as in some areas, deprivation is concentrated within smaller neighbourhoods, where affluence and deprivation are “cheek by jowl”.
The census examines four dimensions of deprivation:
- Employment - a household is considered deprived if any member of a household, who is not a full-time student, is either unemployed or off of work due to long-term sickness.
- Education - a household is considered deprived if no person in the household has at least level 2 education, and where no person aged 16-18 is in full-time education.
- Health and disability - a household is considered deprived if any person in the household reports their general health to be bad or very bad or if any person in the household reports that they have a long term health problem.
- Household overcrowding - a household is considered deprived if the household accommodation is overcrowded (with an occupancy rating of -1 or less), or if the household is in a shared dwelling, or has no central heating.
The output for this measure of deprivation is the proportion of households which are identified as deprived on none, one, two, three, or four of the above dimensions of deprivation. Census data is provided at the LSOA level, and as LSOAs are coterminous with CCG boundaries it is possible to determine the proportion of households in the CCG which were deprived on Census day 2011. The table below shows the proportions of households identified as deprived on none, one, two, three, or four deprivation dimensions for each of the CCGs in West Sussex.2
| Area | Not deprived in any dimension | Deprived on one dimension | Deprived on two dimensions | Deprived on three dimensions | Deprived on four dimensions |
|---|---|---|---|---|---|
| NHS Crawley CCG | 42.1% | 34.6% | 18.5% | 4.5% | 0.4% |
| NHS Coastal West Sussex CCG | 44.0% | 34.3% | 17.70% | 3.60% | 0.4% |
| NHS Horsham and Mid Sussex CCG | 53.9% | 31.0% | 12.6% | 2.4% | 0.2% |
| West Sussex CCGs combined | 46.4% | 33.4% | 16.4% | 3.4% | 0.3% |
| Area | Number of households |
|---|---|
| NHS Crawley CCG | 42,727 |
| NHS Coastal West Sussex CCG | 212,042 |
| NHS Horsham and Mid Sussex CCG | 90,845 |
| West Sussex CCGs combined | 345,614 |
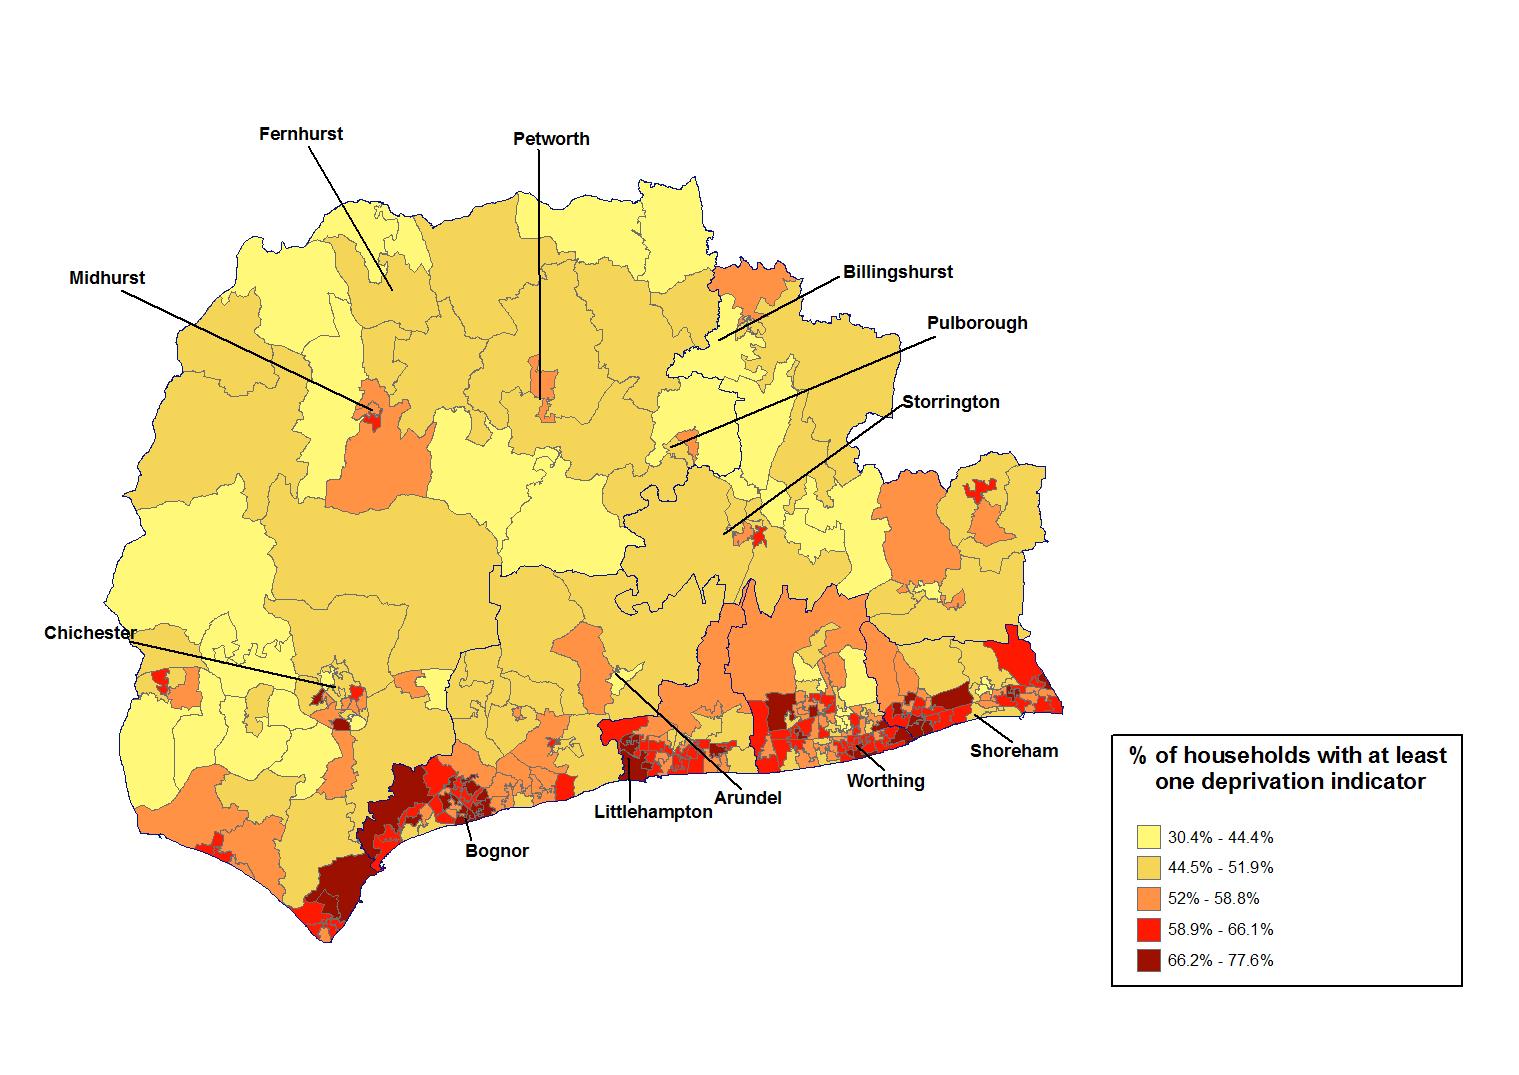
The map below shows the proportion of households at Lower-layer super output area level in NHS Coastal West Sussex that were identified as deprived on at least one measure of deprivation from the 2011 Census. Darker areas indicate a higher proportion of deprived households.
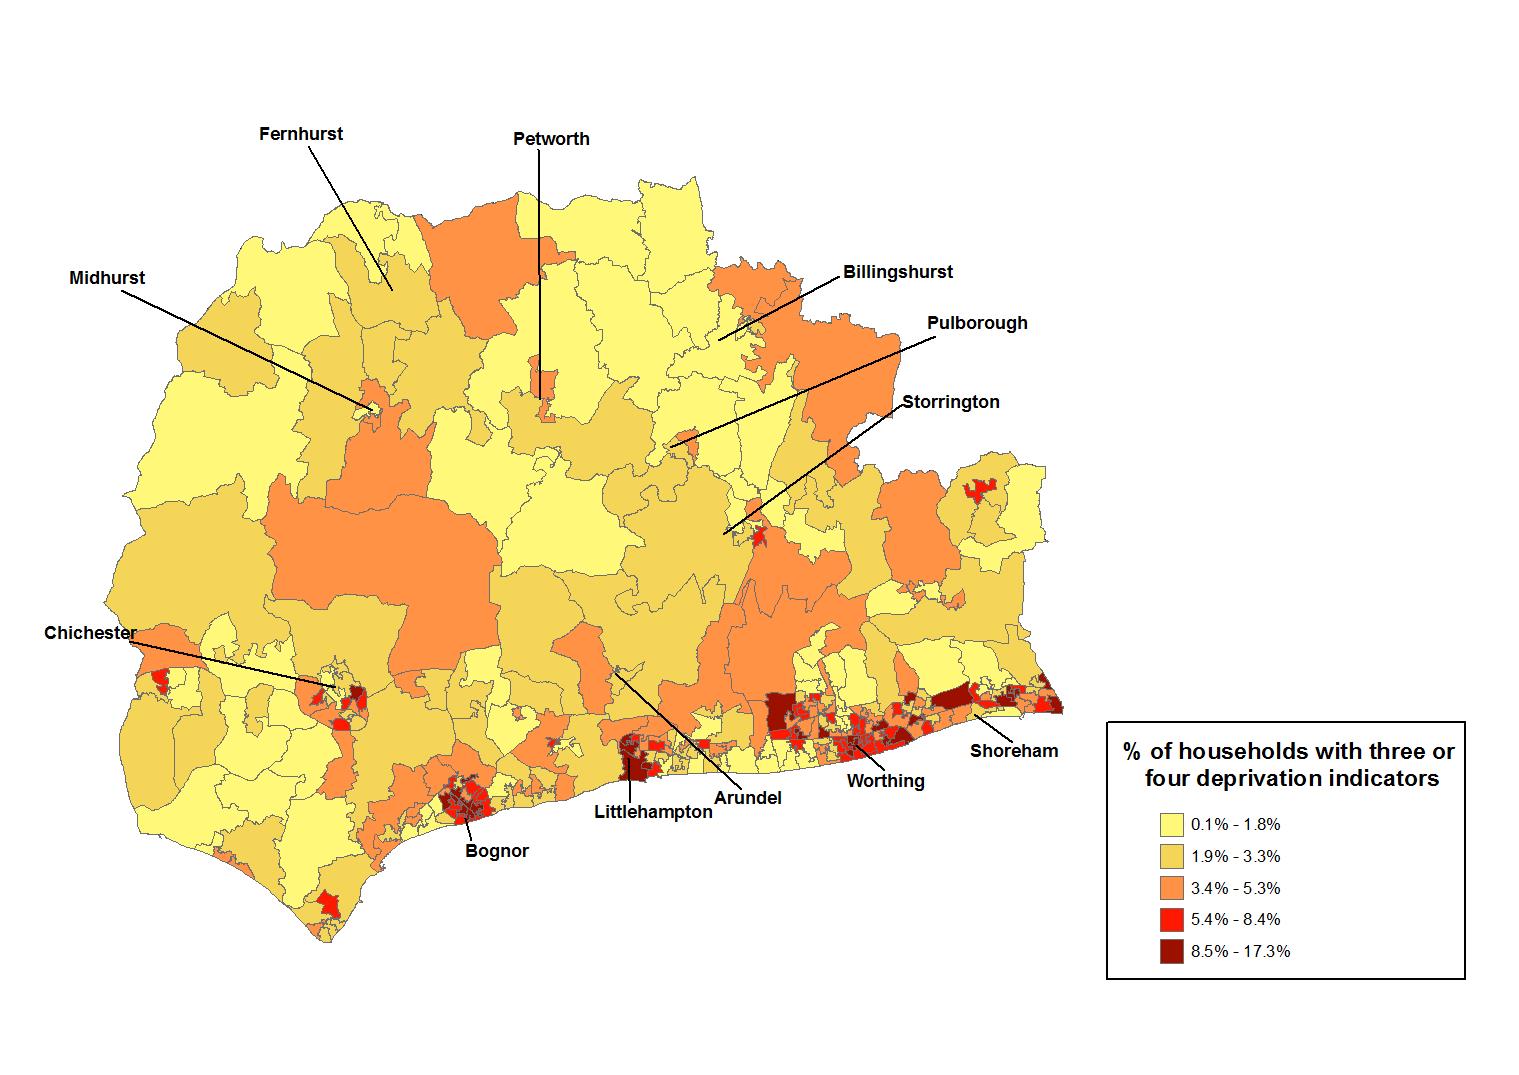
The map below shows the proportion of households at Lower-layer super output area level in NHS Coastal West Sussex that were identified as deprived on three or four measures of deprivation from the 2011 Census. Darker areas indicate a higher proportion of deprived households. Using the census 2011 groupings these represent the most deprived areas in the Coastal West Sussex CCG region.
Child Poverty
This section contains data on the number and proportion of under 16 year olds living in low income households.
There is strong evidence linking childhood poverty to poorer outcomes throughout childhood and later life, including lower educational attainment, poorer job prospects, lower earnings and lower life expectancy.
At a national level, four key measures of child poverty are published:
- Relative low income: Children living in households whose income is less than 60% of the median income (after adjusting for household type and size).
- Combined low income and material deprivation: A combination of the level of income and also material aspects (for example whether children have been able to go on school trips, or can go swimming once a month).
- Absolute low income and persistent low income: This measures income compared to a fixed baseline.
- Persistent low income: Relative low income persists for three of the previous four years.
At a county level and below (e.g. local authority districts), only data on relative low income are available. Information is provided for children aged under 16 years, and also for all children (where young people under the age of 20 years are living at home either in full-time education or unemployed). Nationally, targets have been adopted for each of the four measures. For the relative low income measure, the national target is for less than 10% of children to be living in low income households by the year 2020.
In 2013, 12.1% of children under the age of 16 years in West Sussex were living in low income households. Within the CCG area, the proportion of children living in low income households ranges from 8.2% in Horsham to 15.3% in Adur.
The table below shows the number and proportion of children under 16 years of age living in low income households in local authority districts of NHS Coastal West Sussex CCG between 2008 and 2013. It should be noted that the data for Horsham reflects the whole district of Horsham and not just the part of Horsham that is designated as NHS Coastal West Sussex CCG.
Percentage of children under 16 years living in low income households: local authorities covering Coastal West Sussex CCG (2008-13)
| Area | 2008 | 2009 | 2010 | 2011 | 2012 | 2013 |
|---|---|---|---|---|---|---|
| Adur | 1,820 (17.5%) | 1,960 (18.7%) | 1,795 (17.2%) | 1,785 (17.0%) | 1,720 (16.1%) | 1,650 (15.3%) |
| Arun | 3,835 (16.3%) | 4,050 (17.1%) | 3,845 (16.2%) | 3,880 (16.3%) | 3,625 (15.0%) | 3,555 (14.6%) |
| Chichester | 2,330 (12.7%) | 2,425 (13.1%) | 2,340 (12.6%) | 2,230 (12.0%) | 2,100 (11.3%) | 2,050 (11.2%) |
| Horsham | 2,065 (8.9%) | 2,275 (9.8%) | 2,195 (9.5%) | 2,095 (9.1%) | 1,890 (8.2%) | 1,865 (8.2%) |
| Worthing | 2,635 (14.8%) | 2,915 (16.1%) | 2,865 (15.7%) | 2,790 (15.2%) | 2,460 (13.3%) | 2,450 (13.3%) |
| West Sussex | 18,490 (13.4%) | 19,950 (14.3%) | 19,345 (13.8%) | 19,070 (13.5%) | 17,655 (12.4%) | 17,210 (12.1%) |
| South East | 233,325 (15.2%) | 249,690 (16.0%) | 243,950 (15.5%) | 239,725 (15.1%) | 226,550 (14.2%) | 219,485 (13.7%) |
| England | 2,068,970 (21.6%) | 2,131,350 (21.9%) | 2,066,320 (21.1%) | 2,026,465 (20.6%) | 1,912,310 (19.2%) | 1,854,005 (18.6%) |
There are also considerable differences in child poverty within the local authority districts in Coastal West Sussex. Although count data (e.g. the exact number of children under the age of 16 living in low income households) are not available for small (LSOA) areas, it is possible to identify the proportion of children living in child poverty. The map below shows the proportion of children under the age of 16 years in each LSOA living in low income households according to child poverty figures for 2013. The map areas are shaded green if the 2020 national target for child poverty of 10% has been met, and grey, orange, and red if the level of child poverty is higher than 10%.
