Estimates and Projections
Population Estimates
Population information is available in different formats depending on the definition used. The registered population is defined as the number of people registered with a GP regardless of where they live and the resident population is defined as the number of people residing in a particular geographical area (e.g. a district).
The GP registered population for NHS Coastal West Sussex CCG in July 2016 is 507,500. NHS Coastal West Sussex CCG has fewer people aged up to 44 years and more people in the 50+ year age groups compared with the resident population of England. Comparison between the registered population and resident population in NHS Coastal West Sussex CCG (as shown in the table below) shows that there is little difference in the number of people in the registered population and resident population at most age groups.
| Age Group | GP Registered Population (July 2016) | Resident Population (MYE 2014) |
|---|---|---|
| Age 0-4 | 25,000 (4.90%) | 26,200 (5.30%) |
| Age 5-14 | 51,800 (10.20%) | 50,800 (10.30%) |
| Age 15-24 | 52,700 (10.40%) | 50,100 (10.20%) |
| Age 25-44 | 113,400 (22.30%) | 104,900 (21.40%) |
| Age 45-64 | 137,100 (27.00%) | 132,900 (27.10%) |
| Age 65-74 | 66,200 (13.00%) | 64,200 (13.10%) |
| Age 75-84 | 41,100 (8.10%) | 41,700 (8.50%) |
| Age 85+ | 20,200 (4.00%) | 19,800 (4.00%) |
| Total | 507,500 | 490,500 |
The table below shows the ONS mid-2014 resident population estimates at local authority district level. Note that Horsham local authority spans both Coastal West Sussex CCG and Horsham and Mid Sussex CCG. As such only the resident population for the area of Horsham local authority that falls within Coastal West Sussex CCG is included in the table. The overall population of Horsham local authority is greater than this figure.
| Area | Total usual resident population | 0-19 years | 65+ years | 75+ years |
|---|---|---|---|---|
| Adur | 63,180 | 14,030 (22.2%) | 14,610 (23.1%) | 7,010 (11.1%) |
| Arun | 154,410 | 30,700 (19.9%) | 43,320 (28.1%) | 21,250 (13.8%) |
| Chichester | 115,530 | 24,110 (20.9%) | 30,550 (26.4%) | 14,930 (12.9%) |
| Horsham* | 50,510 | 10,680 (21.1%) | 13,490 (26.7%) | 6,240 (12.4%) |
| Worthing | 106,860 | 23,450 (21.9%) | 23,690 (22.2%) | 12,050 (11.3%) |
| CCG | 490,490 | 102,970 (21.0%) | 125,660 (25.6%) | 61,490 (12.5%) |
| West Sussex | 828,400 | 186,330 (22.5%) | 183,970 (22.2%) | 89,220 (10.8%) |
| England | 54,316,620 | 12,907,330 (23.8%) | 9,537,710 (17.6%) | 4,374,840 (8.1%) |
NHS Coastal West Sussex CCG has below average percentage of young people aged 0-19 years compared to the whole of West Sussex and England. It also has above average percentages of people aged 65 and over, and 75 and over when compared to the West Sussex county and England overall.
Population Projections
Projections of future population changes are based primarily on trends observed in levels of births, deaths and migrations in local authorities over the 5 years leading to 2014, and these are used to predict population change until 2039.
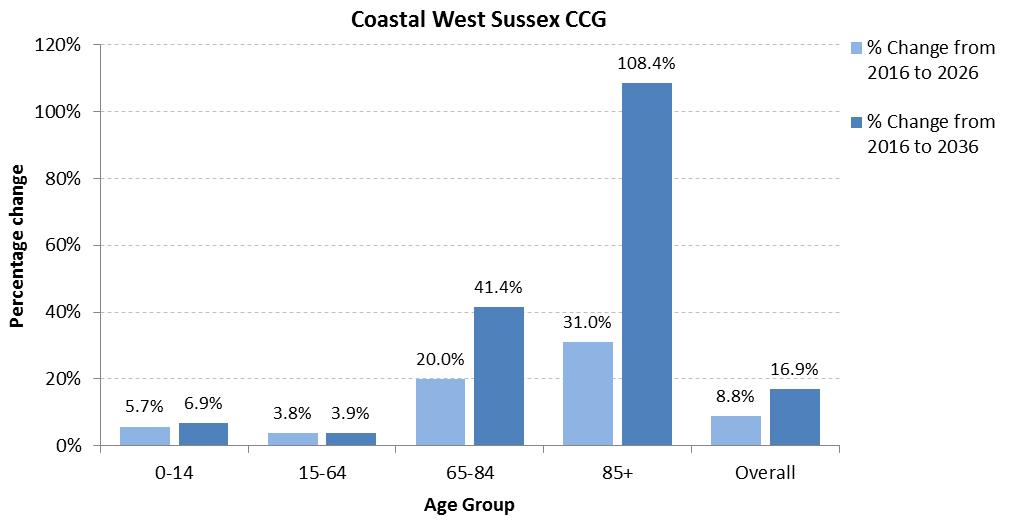
Current population projections for NHS Coastal West Sussex CCG are estimating an overall population increase of 8.3% over the next ten years and a 16.2% increase over the next two decades. Higher percentage increases are expected in older age groups, specifically persons aged 65-84 years (+20.0% by 2026, and +41.4% by 2036) and aged 85 years or above (+31.0% by 2026, and +108.4% by 2036). The population of those aged 85 or above is expected to more than double by 2036 in NHS Coastal West Sussex.
Note: The projections included in this report show projected change to 2036. These are subnational population projections (SNPP) that were produced by the ONS in 2016, and are based on the 2014 mid-year population estimates. As a result, these estimates are based on the old CCG boundary where four lower-layer super output areas (LSOAs) were formerly assigned to Guildford and Waverley CCG. This is reflected in the difference between the total population size presented in the projection table below, and the mid-year estimates table, and equates to a deficit of around 7,000 residents. As such, the projections for Coastal West Sussex (particularly for later years) are likely to underestimate the projected population size of the CCG area when the new boundary is taken into account.
| Age Group | 2016 (projection from 2014 MYE) | 2026 Projection | % Change from 2016 projection to 2026 | 2036 Projection | % Change from 2016 projection to 2036 |
|---|---|---|---|---|---|
| 0-14 | 77,100 | 81,500 | 5.7% | 82,400 | 6.9% |
| 15-64 | 286,000 | 297,000 | 3.8% | 297,100 | 3.9% |
| 65-84 | 108,200 | 129,800 | 20.0% | 153,000 | 41.4% |
| 85+ | 20,300 | 26,600 | 31.0% | 42,300 | 108.4% |
| Overall | 491,600 | 534,900 | 8.8% | 574,800 | 16.9% |