Alcohol
On this page, statistics are given for alcohol related behaviours, hospital activity and mortality.
Data for alcohol related behaviours include an estimate of the alcohol consumption patterns (e.g. percentage of those who abstain from alcohol, those who consume a lower risk amount, those who consume an increasing risk amount and those who consume a higher risk amount of alcohol) at Local Authority District level. Also included in the behaviours section is the rate of alcohol-related road traffic accidents (e.g. reported drink drive accidents) for each CCG in West Sussex.
Hospital activity, and mortality, are given at CCG level for conditions specific to alcohol and those related to alcohol:
- Alcohol-specific conditions: Conditions where alcohol is causally implicated in all cases of the condition. In this case the alcohol attributable fraction (the proportion of a health condition or external cause that is attributable to a specific risk factor in a given population) is 1.0, as all cases (100%) are caused by alcohol.
- Hospital-related conditions: All alcohol-specific conditions plus those where alcohol is causally implicated in some but not all causes of the outcome (e.g. hypertensive diseases, some cancers, and some cases of falls). The alcohol-attributable fraction will range from 0 to 1.0 according to the proportion of cases where the condition was caused by alcohol.
With the exception of modelled alcohol consumption estimates, all indicators are presented at CCG level.
Drinking behaviours
The North West Public Health Observatory (NWPHO) working with Liverpool John Moores University produced modelled estimates of drinking behaviour (among those aged 16 years and over) at Local Authority District level based on lifestyle survey data, hospital admissions, mortality data and population characteristics. Estimates for four groups were calculated: abstainers, lower risk drinkers, increasing risk drinkers and higher risk drinkers, aligned to national definitions.
Lower risk drinkers are defined as consumers of no more than 21 units per week for males and no more than 14 units per week for females. Increasing risk drinkers are defined as consumers of between 22 and 50 units of alcohol per week for males and between 15 and 35 units per week for females. Higher risk drinkers are consumers of above 50 units per week for males and more than 35 units per week for females.
The tables below show the modelled estimates of drinking behaviour for Local Authority Districts in NHS Coastal West Sussex CCG. The first table is an estimate of the whole population (including abstainers) and the second table is for drinkers only. In both tables, confidence intervals are very large and overlap. As such, the percentage estimates should be treated with caution.
Modelled drinking behaviours for Local Authority Districts in NHS Coastal West Sussex CCG; 2011.
| Area | Abstain | 95% CI | Lower Risk | 95% CI | Increasing Risk | 95% CI | Higher Risk | 95% CI |
|---|---|---|---|---|---|---|---|---|
| Adur | 12.9% | 7.5-20.0% | 66.7% | 40.5-81.7% | 16.1% | 5.0-40.6% | 4.3% | 1.4-13.9% |
| Arun | 10.8% | 6.2-16.5% | 60.6% | 33.2-79.1% | 23.7% | 7.8-51.5% | 5.0% | 1.6-15.7% |
| Chichester | 8.5% | 4.7-13.5% | 61.2% | 32.4-80.0% | 23.0% | 7.1-52.0% | 7.3% | 2.1-22.9% |
| Horsham | 8.8% | 4.9-14.0% | 60.7% | 30.7-80.4% | 23.9% | 7.2-54.1% | 6.6% | 1.8-22.1% |
| Worthing | 10.9% | 6.5-16.4% | 60.3% | 33.1-78.7% | 23.8% | 7.9-51.3% | 5.0% | 1.6-15.9% |
| South East | 12.1% | 7.3-18.1% | 63.7% | 36.7-80.3% | 18.3% | 5.7-44.1% | 5.9% | 1.8-18.8% |
Modelled drinking behaviours - estimates for those who drink in Local Authority Districts of NHS Coastal West Sussex CCG; 2011.
| Area | Abstain | 95% CI | Lower Risk | 95% CI | Increasing Risk | 95% CI | Higher Risk | 95% CI |
|---|---|---|---|---|---|---|---|---|
| Adur | - | - | 76.6% | 47.2-90.4% | 18.5% | 5.6-46.5% | 5.0% | 1.5-16.5% |
| Arun | - | - | 37.9% | 37.2-86.2% | 26.5% | 8.6-56.8% | 5.6% | 1.7-18.0% |
| Chichester | - | - | 66.9% | 35.4-85.5% | 25.1% | 7.7-56.4% | 8.0% | 2.3-25.4% |
| Horsham | - | - | 66.5% | 33.6-86.2% | 26.2% | 7.8-58.7% | 7.2% | 1.9-24.5% |
| Worthing | - | - | 67.6% | 37.2-86.% | 26.7% | 8.8-56.9% | 5.6% | 1.7-18.1% |
| South East | - | - | 72.5% | 41.7-91.3% | 20.8% | 6.4-50.1% | 6.7% | 2.0-21.4% |
Whilst the topography of drinking behaviours is currently only available at the Local Authority District level, other drinking behaviours are recorded for the CCGs, including alcohol related road accidents.
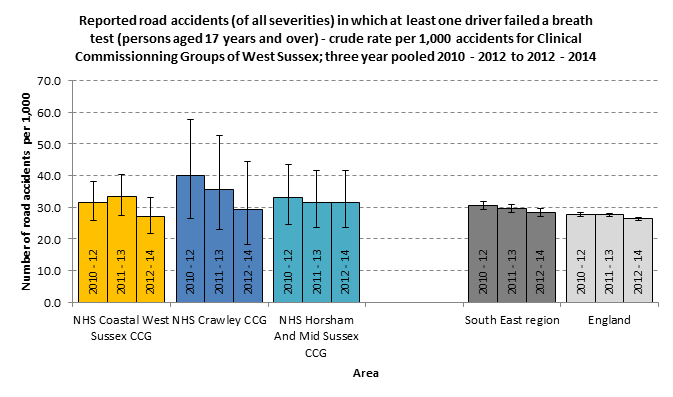
An alcohol related road accident is defined as a reported incident on a public road in which someone is killed or injured, where at least one of the motor vehicle drivers or riders involved either refused to give a breath test specimen when requested by the police (other than when incapable of doing so for medical reasons) or failed a roadside breath test by registering above 35 micrograms of alcohol per 100ml of breath. The statistic only includes incidents on public roads known to the police within 30 days of occurrence and so this is expected to be an underestimate of drink drinking behaviours. Data are pooled over three year periods to increase the accuracy of estimates.
In England, the rate per 1,000 for reported road accidents in which at least one driver failed a breath test has declined significantly between 2011-13 (27.6 accidents per 1,000 accidents, 95% CI: 27.1 – 28.2) and 2012-14 (26.4 accidents per 1,000 accidents, 25.8 – 26.9). In NHS Coastal West Sussex CCG, the crude rate of alcohol related road accidents in 2012-14 was 27 alcohol related road accidents per 1,000 accidents (95% CI: 21.8 – 33.1 accidents), which is not significantly different from 2011-13 (33.4 accidents per 1,000, 95% CI:27.5 – 40.3 accidents) or compared to the national rate.
The chart below shows the three year trend in alcohol related road traffic accidents in the three West Sussex CCGs between 2010-12 and 2012-14. As can be seen from the chart, there are large, overlapping confidence intervals at CCG level, indicating that there may be no difference across the CCGs.
Alcohol related hospital activity
As part of the Local Alcohol Profiles for England, the Knowledge and Intelligence Team (North West) calculates the number of men and women admitted to hospital each year for alcohol-specific (conditions where alcohol is causally implicated in all cases of the condition) and alcohol-related conditions (alcohol-specific conditions plus those where alcohol is causally implicated in some but not all cases), yielding a period prevalence estimate of the number of persons admitted to hospital at least once during the course of a financial year. The analysis is carried out using data from the Health and Social Care Information Centre – Hospital Episode Statistics (HES) and Office for National Statistics (ONS) – Mid Year Population Estimates. There can be up to 20 diagnosis codes for a single episode, and one individual can have multiple episodes in a given year. As such, rules are used to avoid double counting of people for statistics which describe the number of people admitted to hospital for alcohol related conditions.
There are two definitions of alcohol-related hospital admissions used in the health profiles:
- Narrow definition: Persons admitted to hospital where the primary diagnosis is an alcohol-attributable code or one of the secondary codes is an external alcohol-attributable code.
- Broad definition: Persons admitted to hospital where the primary diagnosis or any of the secondary diagnoses are an alcohol-attributable code.
It should be noted that hospital admission data can be coded differently in different parts of the country. Moreover, in some cases, details of the patient’s residence are insufficient to allocate the patient to a particular area and in other cases the patient has no fixed abode. These cases are included in the England total but not in the smaller area (e.g. CCG level). Finally, some indicators are person based and others are admission based. For example, the number of people admitted to hospital due to alcohol-related conditions per 100,000 European Standard Population is a person-specific measure whilst the number of admission episodes for alcohol-related conditions per 100,000 European Standard Population is an admission-specific measure.
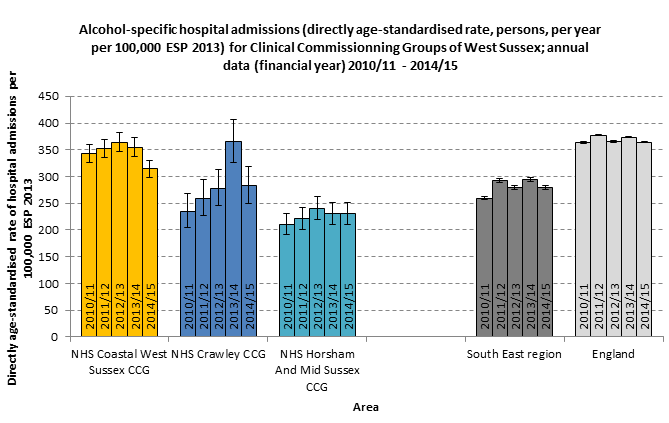
In NHS Coastal West Sussex CCG in 2014/15, 1,505 people were admitted at least once to hospital for an alcohol-specific condition, at a rate of 314.3 people per 100,000 European Standard Population (ESP 2013) (95% CI: 298.3 – 330.8 people). This was similar to NHS Crawley CCG (282.4 people admitted per 100,000 ESP 2013, 95% CI: 249.7 – 318.1 people) for the same period but higher than NHS Horsham and Mid Sussex CCG (229.8 people admitted per 100,000 ESP 2013, 95% CI: 210.2 – 250.8 people) and overall in the South East region (279.6 people admitted per 100,000, 95% CI: 276.1 – 283.2 people). However, the NHS Coastal West Sussex CCG rate of people admitted for alcohol-specific conditions was significantly lower than the rate for England in the same period (364.4 people admitted per 100,000 ESP 2013, 95% CI: 362.8 – 366.1 people). The chart below shows the annual trend data for West Sussex CCGs between 2010/11 and 2014/15 for persons admitted to hospital for alcohol-specific conditions. The chart indicates that although there is an upward trend in NHS Coastal West Sussex CCG in the first three years of the period, followed by a downward trend more recently, differences may not be significant across individual years. However, there was a significant decline in the rate of alcohol-specific hospital admissions in NHS Coastal West Sussex CCG between 2013/14 (354.6 people admitted per 100,000 ESP 2013, 95% CI: 337.7 – 372.1 people) and the current rate of 314.3 people (95% CI: 298.3 – 330.8) per 100,000 ESP 2013.
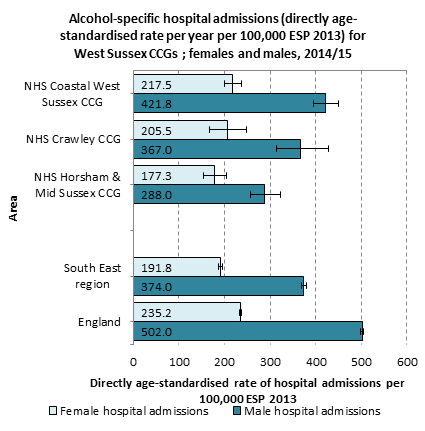
The number of people admitted to hospital for alcohol-specific conditions differs significantly among men and women, with men consistently having a higher rate of people admitted to hospital in all West Sussex CCGs, the South East region and in England in 2014/15 (see the chart below). In 2014/15, 970 men were admitted to hospital for an alcohol-specific condition in NHS Coastal West Sussex CCG, at a rate of 421.8 people admitted per 100,000 ESP 2013 (95% CI: 395.3 – 449.5 people admitted). This is significantly higher than the female rate of admissions for NHS Coastal West Sussex CCG in the same year (217.5 people admitted per 100,000 ESP 2013, 95% CI: 199.1 – 237.2 people, n=530 people admitted).
Admission Episodes
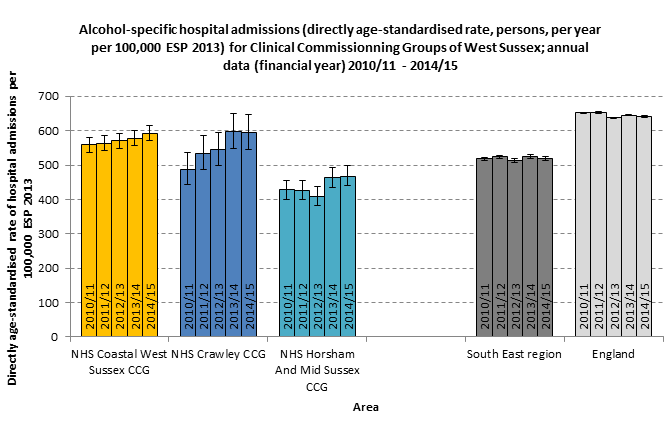
In 2014/15, there were 3,001 admission episodes for alcohol-related conditions (narrow definition) in NHS Coastal West Sussex CCG. This represented 592.4 admissions per 100,000 ESP 2013 (95% CI: 571 – 614.5 admissions per 100,000 ESP 2013). Similarly to the number of people admitted for alcohol-specific conditions, the NHS Coastal West Sussex CCG admission episodes rate was similar to NHS Crawley CCG (593.5 admissions per 100,000 ESP 2013, 95% CI: 544.5 – 645.6 admissions), higher than NHS Horsham and Mid Sussex CCG (468.1 admissions per 100,000 ESP 2013, 95% CI: 440 – 497.5 admissions) and lower than the England rate overall (640.8 admissions per 100,000 ESP 2013, 638.6 – 643 admissions). The chart below shows the trend in alcohol related (narrow definition) admissions per 100,000 ESP 2013 for years 2010/11 to 2014/15. As can be seen from the chart, although the admissions rate has increased in NHS Coastal West Sussex CCG, the overlapping confidence intervals suggest that there may be no significant difference across years.
Hospital admissions episodes for alcohol related conditions by age
Admission episode statistics for alcohol-related conditions are also broken down by age group. In 2014/15, just under one in five admission episodes in NHS Coastal West Sussex CCG due to alcohol related conditions (narrow definition) were for those aged under 40 years (596 admission episodes, 19.9% of admission episodes, 95% CI: 18.5 – 21.3%). Two in five admission episodes in 2014/15 in the CCG were to those aged 40-64 years (1,267 admission episodes, 42.2% of alcohol related admission episodes, 95% CI: 40.4% – 44%) and around one third of admission episodes were to those aged 65 years and over (37.9%, 95% CI: 36.2 – 39.7%).
There is a significant difference in the rate of admission episodes related to alcohol in NHS Coastal West Sussex CCG in 2014/15 between the three age groups as shown in the chart below.
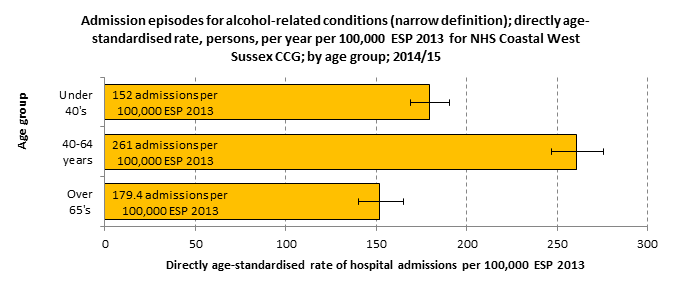
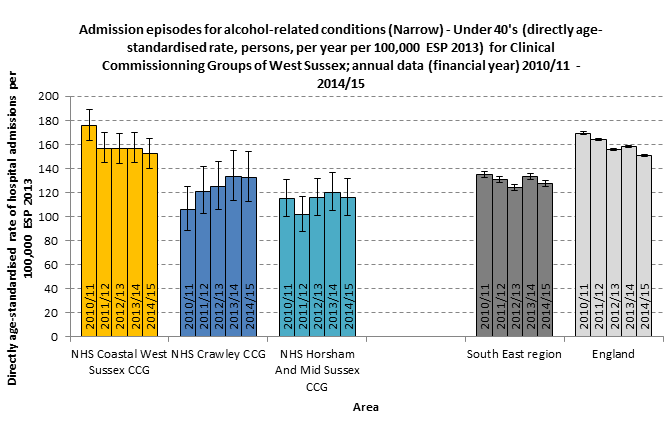
Among those aged under 40 years, the rate of admission episodes for alcohol related conditions (narrow definition) in NHS Coastal West Sussex CCG, in 2014/15, was 152 admission episodes per 100,000 ESP 2013 (95% CI: 140 – 164.8 episodes). This is not significantly different to NHS Crawley CCG (132.5 admission episodes per 100,000 ESP 2013, 95% CI: 112.6 – 154.3) or England (150.6 episodes per 100,000 ESP 2013, 95% CI: 149.6 – 151.6) although it is higher than the admission episode rate among under 40s in NHS Horsham and Mid Sussex CCG (116 episodes per 100,000 ESP, 95% CI: 101.3 – 132). The chart below shows the five year annual trend for under 40s’ alcohol related hospital activity in West Sussex CCGs.
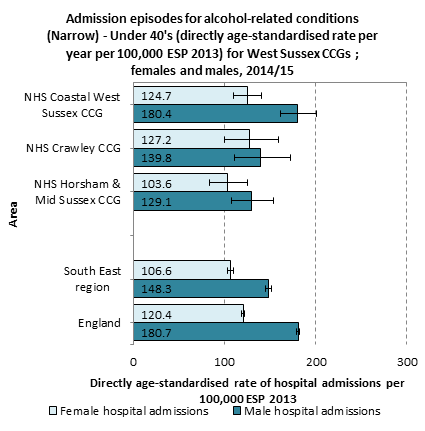
In NHS Coastal West Sussex CCG, in 2014/15, the admission episode rate for under 40’s was significantly higher among men (180.4 alcohol-related admission episodes per 100,000 ESP 2013, 95% CI: 161.7 – 200.4) compared to women (124.7 admission episodes per 100,000 ESP 2013, 95% CI: 109.4 – 141 episodes); following patterns at the region and national level (see chart below). In the other West Sussex CCGs, there is no significant difference in alcohol-related admission episodes between men and women aged under 40 years in 2014/15.
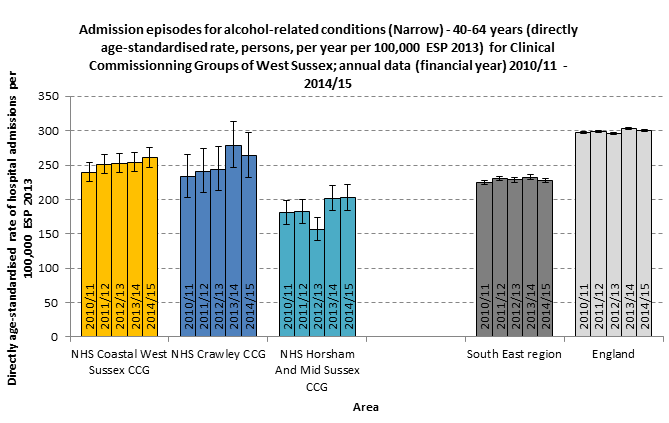
Among those aged 40-64 years, the rate of hospital admission episodes for alcohol-related conditions (narrow definition) was 261 admissions per 100,000 ESP 2013, 95% CI: 246.8 – 275.8) in NHS Coastal West Sussex CCG in 2014/15. Again, the NHS Coastal West Sussex CCG rate is comparable to NHS Crawley CCG (263.7 episodes per 100,000 ESP 2013, 95% CI: 232.4 – 297.5 episode) but significantly higher than NHS Horsham and Mid Sussex CCG (202.2 episodes per 100,000 ESP 2013, 95% CI: 184.5 – 221.1). The admission episode rate for 40-64 year olds in NHS Coastal West Sussex CCG is significantly lower than the rate for England in 2014/15 (299.6 episodes per 100,000 ESP 2013, 95% CI: 298.1 – 301.1). The chart below shows the five year annual trend for alcohol related hospital activity in West Sussex CCGs among those aged 40-64 years.
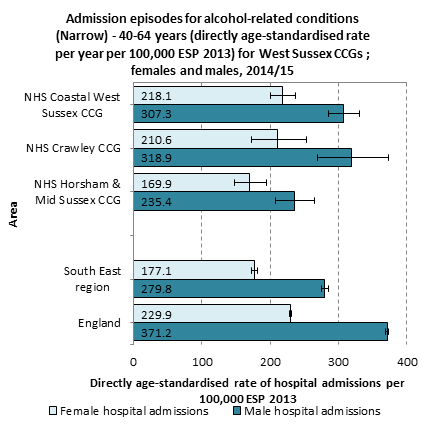
The hospital admissions for conditions related to alcohol (narrow definition) for those aged 40-64 years in 2014/15 was significantly higher among males (307.3 admissions per 100,000 ESP, 95% CI: 285.2 – 330.6 admissions) compared to females (218.1 admissions per 100,000 ESP 2013, 95% CI: 200.2 – 237.2) in the CCG. The chart below shows the hospital admission episode rate among men and women in West Sussex CCGs in 2014/15.
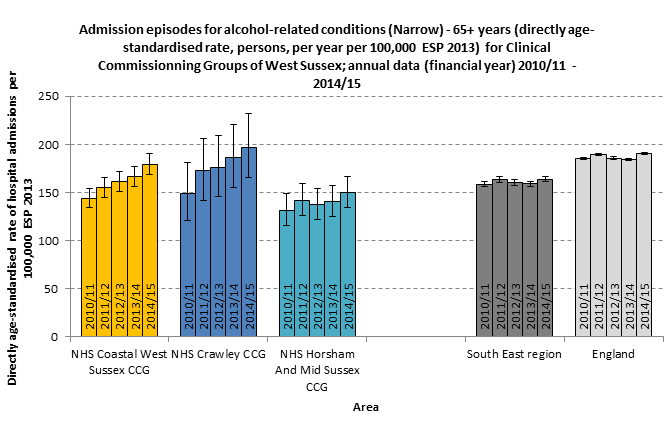
The rate of admissions in NHS Coastal West Sussex CCG, in 2014/15, among those aged 65 years and over was 179.4 admission episodes per 100,000 ESP 2013 (95% CI: 169.1 – 190.2) and this is similar to the rate in NHS Crawley CCG (197.3 admissions per 100,000 ESP 2013, 95% CI: 166.1 – 232.5 admissions) but significantly higher than the admission episode rate for NHS Horsham and Mid Sussex CCG (149.9 admission episodes per 100,000 ESP 2013, 95% CI: 134 – 166.7). The NHS Coastal West Sussex CCG rate is similar to the rate for England in this period (190.5 admissions per 100,000 ESP 2013, 95% CI: 189.3 – 191.8). The chart below shows the five year trend in alcohol-related admissions (narrow definition) per 100,000 ESP 2013 for West Sussex CCGs between 2010/11 and 2014/15.
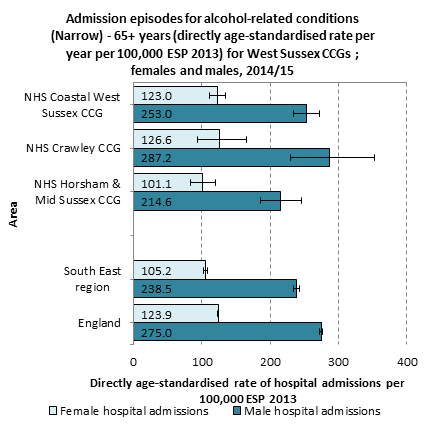
The rate of admission episodes among those aged 65 and over is significantly higher for men (253 admission episodes per 100,000 ESP 2013, 95% CI: 234.5 – 272.5) compared to women (123 admission episodes per 100,000 ESP 2013, 95% CI: 111.6 – 135.3) as shown in the chart below.
Alcohol related mortality
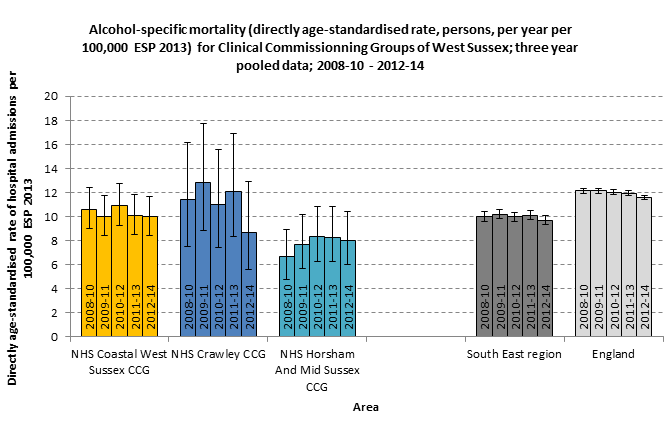
Alcohol-specific mortality (where alcohol is causally implicated in all cases of the condition or external cause of death) is based on three consecutive years of mortality data and is a directly age-standardised rate per year per 100,000 population (standardised to the European Standard Population, ESP 2013). In the period 2012-14, there were 149 alcohol-specific deaths in NHS Coastal West Sussex CCG, representing a rate of 10 deaths per 100,000 ESP 2013 (95% CI: 8.4 – 11.7 deaths). This is statistically similar to the alcohol specific mortality rate in NHS Crawley CCG (8.7 deaths per 100,000 ESP 2013, 95% CI: 5.6 – 12.9 deaths), NHS Horsham and Mid Sussex CCG (8 deaths per 100,000 ESP 2013, 95% CI: 6 – 10.4 deaths) and England (11.6 deaths per 100,000 ESP 2013, 95% CI 11.4 – 11.8 deaths). The large, overlapping, confidence intervals at CCG level shown in the five year trend chart below may be the product of the small number of deaths included at this level.
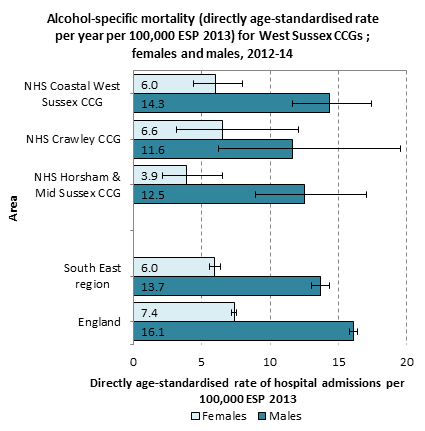
Data for alcohol-specific mortality are available at CCG level for men and women separately. This data indicates that in 2012-14, there were 102 alcohol-specific deaths among men in NHS Coastal West Sussex CCG, at a rate of 14.3 deaths per 100,000 ESP 2013, 95% CI: 11.7 – 17.4 deaths). This is significantly higher than the rate of alcohol-specific deaths among women in NHS Coastal West Sussex CCG in 2012-14 (6 deaths per 100,000 ESP 2013, 95% CI: 4.4 – 8 deaths, based on 47 deaths). The chart below shows the alcohol-specific mortality rate among men and women in West Sussex CCGs in 2012-14 and indicates that the pattern in NHS Coastal West Sussex CCG (that men have a significantly higher alcohol-specific mortality rate than women) follows NHS Horsham and Mid Sussex CCG, South East region, and national data.
Months of life lost due to alcohol provide an estimate of the increase in life expectancy if all alcohol related deaths among those under 75 years were prevented. This data is available for lower and upper tier Local Authorities as well as CCGs and the latest data is available for the pooled period 2012-14.
For men in England, in 2012-14, one year of life is lost on average due to alcohol-related conditions. In NHS Coastal West Sussex CCG, 11.2 months of life are lost for men due to alcohol. The table below shows the months of life lost due to alcohol for males in West Sussex CCGs between 2008-10 and 2012-14. Confidence intervals are not available for these estimates. With the exception of NHS Crawley CCG in 2009-11, the table shows that the months of life lost are consistently higher in NHS Coastal West Sussex CCG compared to other CCGs in West Sussex, as well as West Sussex county over the five years of data.
Months of Life Lost due to alcohol; Males in West Sussex CCGs; 2008-10 to 2012-14
| Area | 2008-10 | 2009-11 | 2010-12 | 2011-13 | 2012-14 |
|---|---|---|---|---|---|
| NHS Coastal West Sussex CCG | 12.0 | 11.5 | 11.2 | 11.1 | 11.2 |
| NHS Crawley CCG | 11.3 | 12.4 | 11.0 | 9.9 | 8.0 |
| NHS Horsham And Mid Sussex CCG | 7.5 | 7.9 | 8.6 | 9.1 | 10.0 |
| West Sussex | 10.6 | 10.5 | 10.4 | 10.4 | 10.5 |
| South East region | 10.9 | 10.8 | 10.5 | 10.6 | 10.5 |
| England | 12.6 | 12.4 | 12.1 | 12.1 | 12.0 |
For women, on average 5.6 months of life was lost in England due to premature alcohol-related deaths for the period 2012-14. In NHS Coastal West Sussex CCG, females lose on average 5 months of life due to alcohol. The table below shows the months of life lost due to alcohol for females in West Sussex CCGs between 2008-10 and 2012-14. Over the five periods of data, females in NHS Coastal West Sussex CCG have lost fewer months, on average, compared to NHS Crawley CCG and England, although months of life lost are higher compared to NHS Horsham and Mid Sussex CCG, and South East region.
Months of Life Lost due to alcohol; Females in West Sussex CCGs; 2008-10 to 2012-14
| Area | 2008-10 | 2009-11 | 2010-12 | 2011-13 | 2012-14 |
|---|---|---|---|---|---|
| NHS Coastal West Sussex CCG | 5.2 | 4.8 | 5.3 | 4.9 | 5.0 |
| NHS Crawley CCG | 5.0 | 6.3 | 6.8 | 7.1 | 5.5 |
| NHS Horsham And Mid Sussex CCG | 4.3 | 4.5 | 5.0 | 4.8 | 4.2 |
| West Sussex | 4.9 | 4.9 | 5.5 | 5.2 | 4.8 |
| South East region | 5.0 | 5.1 | 5.0 | 5.0 | 4.9 |
| England | 5.8 | 5.8 | 5.7 | 5.6 | 5.6 |