Weight and Healthy Eating
Childhood Obesity
This section includes data from the National Child Measurement Programme (NCMP).
Overweight and obese children are more likely to become obese adults, and have a higher risk of mortality, disability and morbidity in adulthood. Metabolic changes such as raised blood pressure and cholesterol may be seen in obese children and teenagers. Childhood obesity is also linked to psychological problems such as low self-esteem, anxiety, and depression, which are often seen by children themselves as the most serious effects.
Data are collected through the National Child Measurement Programme, with pupils aged 4-5 years (reception) and 10-11 years (year 6). This collects data from state-maintained schools, and excludes private and special schools. West Sussex County Council is responsible for the collection of measurements from children who attend schools in West Sussex, this will include children who live outside the county but who attend schools within the county border. It does not collect or record data on children who are resident in West Sussex but who attend school outside the county.
The National Child Measurement Programme (NCMP) remains voluntary but coverage rates in West Sussex are good. Across England, 96% of children in reception and 94% of children in year 6 were measured in 2014/15. In West Sussex, participation rates were slightly lower; 90% of children in reception and 91% of children in year 6 were measured in 2014/15. Information on children is aggregated to various geographies, including CCG area. Information relates to the home postcode of the pupils.
Children are classified as obese using the population monitoring definitions of weight status and using the following UK90 population thresholds.
- Underweight: <= 2nd centile
- Healthy weight: > 2 to < 85th centile
- Overweight: >= 85th centile
- Obese: >= 95th centile
These thresholds are lower than the thresholds used in the definition of clinical overweight and obesity; this is to capture those children with a weight problem and those at risk of developing a weight problem (i.e. those children who may be on the border line of the clinical definition). This helps ensure that adequate services are planned and delivered for the whole population.
Source: National Obesity Observatory, PHE.
Childhood Obesity – Reception
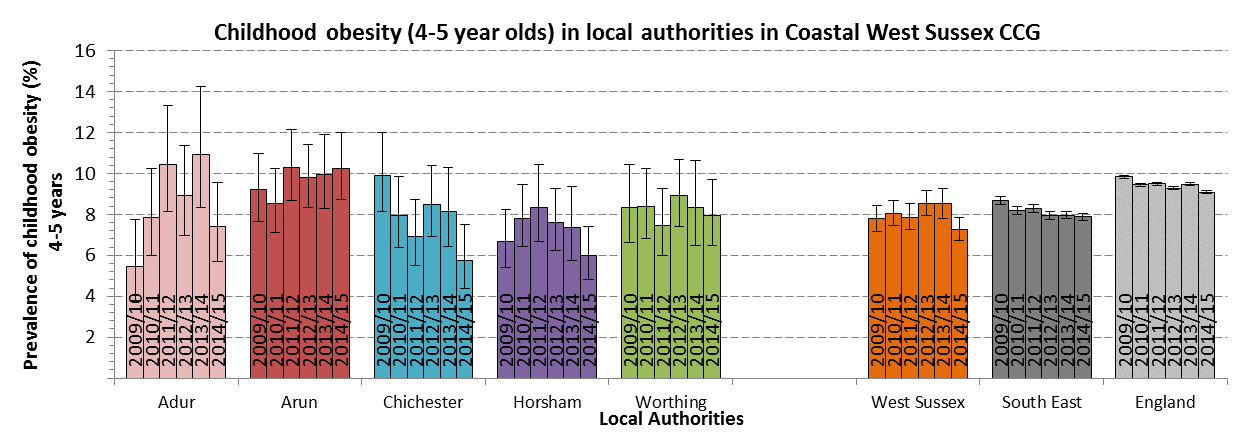
The figure below shows the prevalence of obesity in reception age children in the local authorities of Coastal West Sussex CCG. The figures for each local authority have wide confidence intervals reflecting the relatively small number of students that are measured in each area. In West Sussex, the prevalence of obesity for children in reception has been significantly below that of England for a number of years, however considerable variation exists at a local level. For example, Arun has a significantly higher proportion of 4-5 year old children who were measured as obese than in Chichester or Horsham (2014/15).
Note: Horsham local authority spans both Coastal West Sussex CCG and Horsham and Mid Sussex CCG. The data in the figure below is for the entirety of Horsham, not just that covered by Coastal West Sussex.
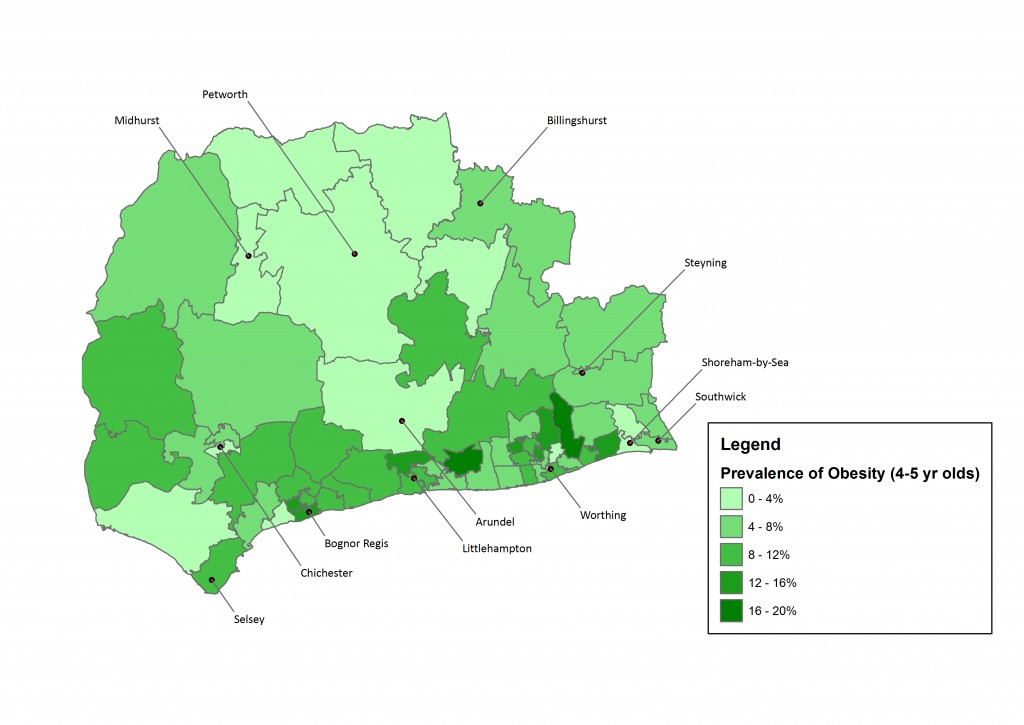
The map below shows the prevalence of 4-5 year olds measured as obese (population definition) in Middle Super Output Areas (MSOAs) in Coastal West Sussex during the 2014/15 academic year. Note that the number of resident children measured by MSOA does vary (ranging from approx. 25 to 130 children per area). This means that estimates of obesity at small area level are less robust, and can change considerably year on year.
Childhood Obesity - Year 6
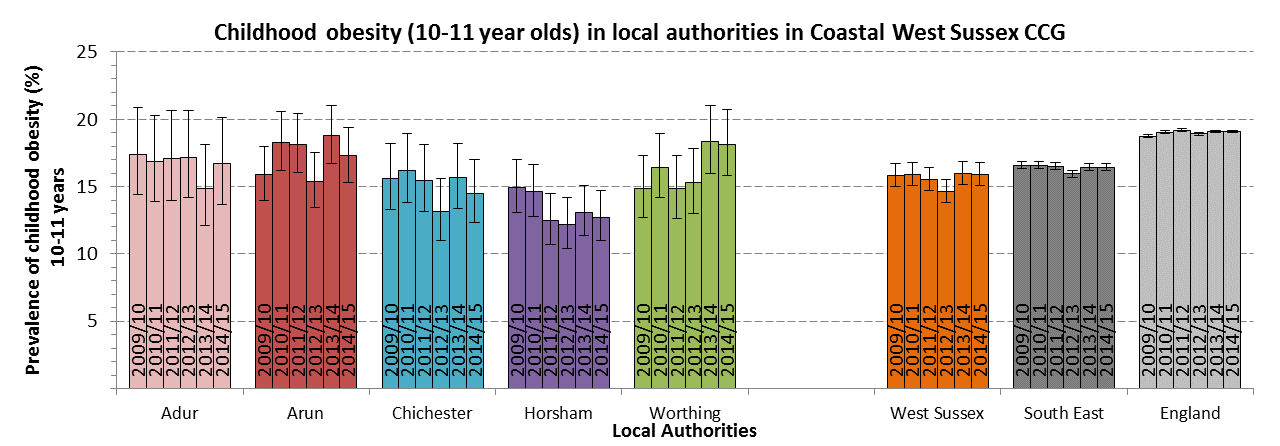
The figure below shows the prevalence of obesity for children in Year 6 in the local authorities of Coastal West Sussex CCG. As above, the figures for each local authority have wide confidence intervals reflecting the relatively small number of students that are measured in each area. In West Sussex, the prevalence of obesity for children in Year 6 has been significantly below that of England for a number of years, although there is little difference with the South East region. Again, considerable variation exists at a local level for example, Arun (17.3%) and Worthing (18.1%) have a significantly higher proportion of 10-11 year old children who were measured as obese than in Horsham (12.7%; 2014/15).
Note. The data in the figure below is for the entirety of Horsham, not just that covered by Coastal West Sussex.
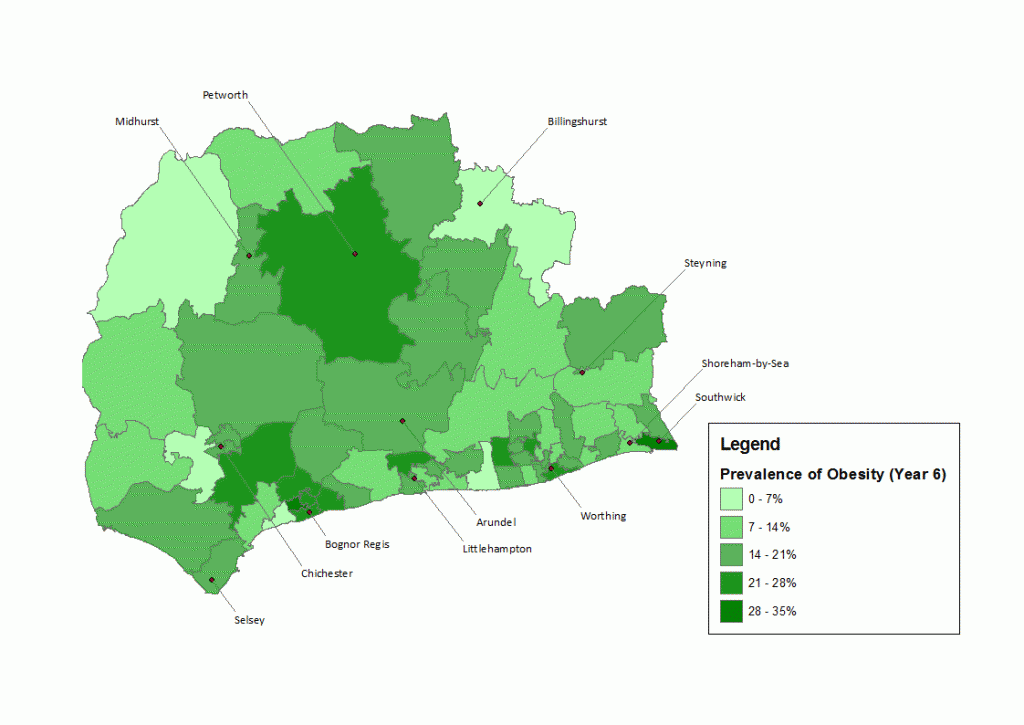
The map below shows the prevalence of children in year 6 who were measured as obese (population definition) in Middle Super Output Areas (MSOAs) in Coastal West Sussex during the 2014/15 academic year. Estimates of obesity prevalence at MSOA level can fluctuate considerably year on year due to variations in the number of resident children by MSOA, and therefore the data presented in the map should be taken with a degree of caution.
Adult Obesity
This section contains data on adult obesity. This is taken from the Active People Survey (APS).
For adults, obesity is generally defined for epidemiological purposes as a body mass index (BMI) equal to, or exceeding 30kg/m^2 (National Obesity Observatory, PHE). Excess weight is defined as a BMI of 25kg/m^2 or more.
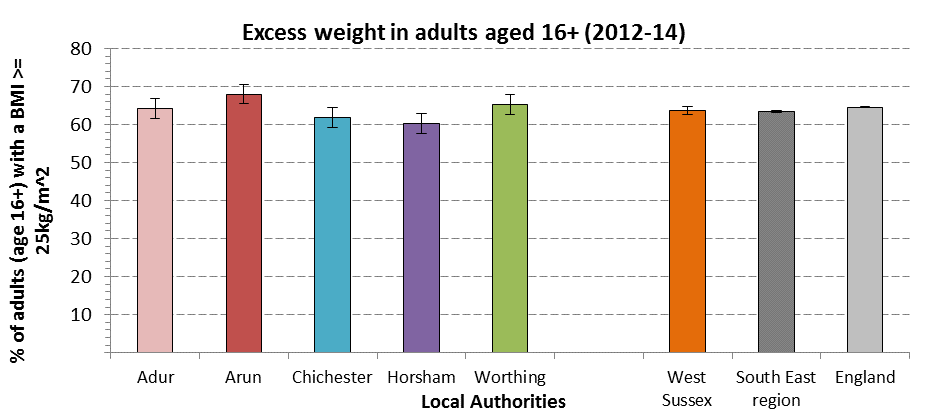
The charts below illustrate the estimated prevalence of obesity (BMI >=30kg/m^2) and excess weight (BMI >=25kg/m^2) among adults across local authorities in Coastal West Sussex CCG. This data is from the Active People Survey and spans 2012-14.
Adjusted estimated percentage of adults (aged 16yrs +) with excess weight (BMI >= 25kg/m^2) for local authorities in West Sussex, 2012-14
At a local authority level, Arun has a significantly greater prevalence of adults with excess weight compared to Chichester and Horsham.
Adjusted estimated percentage of adults (aged 16yrs +) with obesity for local authorities in West Sussex, 2012-14
At a local authority level, Horsham has a significantly lower proportion of obese adults than Worthing, Adur and Arun. West Sussex and the South East region both have a significantly lower proportion of adult obesity than national estimates suggest.

Healthy Eating
The 5-a-day message from the NHS is based on WHO recommendations, using evidence that populations consuming at least 400g of fruit and vegetable per day can reduce the risk of death from chronic disease such as heart disease, stroke, and some cancers.
This is based on people eating at least 5 portions of a variety of fruit and vegetables each day. In the Coastal West Sussex CCG area, between 26% to 33% of people are estimated to eat the recommended number of portions (APHO 2006-08 modelled prevalence).
Model based estimate for consumption of fruit and vegetables
The figure presents modelled estimates of fruit and vegetable consumption in the Coastal West Sussex area.
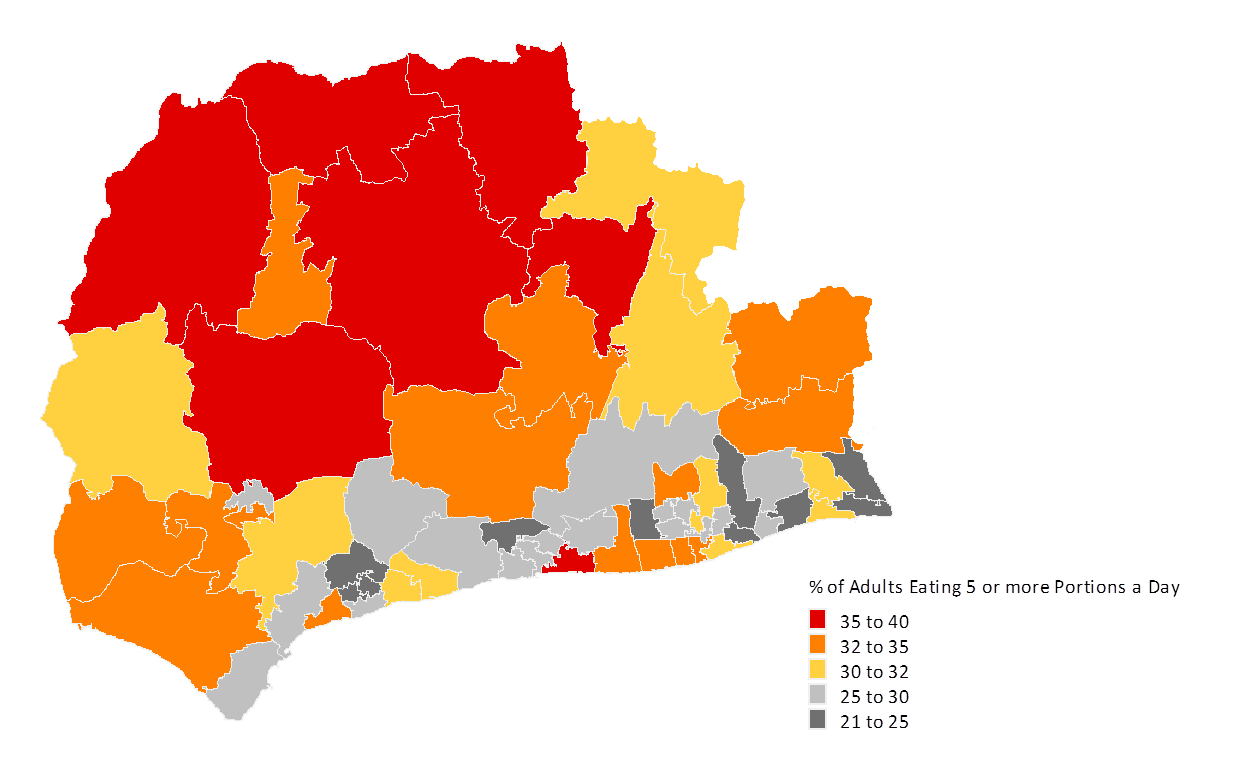
The table demonstrates that in local authorities in Coastal West Sussex CCG, there is little difference in the modelled prevalence of fruit and vegetable consumption compared to England.
Percentage of adults estimated to eat at least 5 portions of fruit and vegetables per day
| Locality | Percent eating 5 or more portions | LCI | UCI |
|---|---|---|---|
| Adur | 26.0% | 21.1% | 31.5% |
| Arun | 28.5% | 25.0% | 32.3% |
| Chichester | 33.5% | 29.1% | 38.2% |
| Crawley | 26.1% | 22.2% | 30.4% |
| Horsham | 32.6% | 28.6% | 37.0% |
| Mid Sussex | 32.3% | 28.3% | 36.5% |
| Worthing | 28.8% | 24.6% | 33.3% |
| West Sussex | 30.1% | 28.5% | 31.7% |
| England | 28.7% | 28.0% | 29.3% |
Active People Survey
In addition to the modelled prevalence shown above, the Active People Survey (Sport England) asks respondents whether they had consumed the recommended 5 portions of fruit and vegetables in the previous day. This survey also records the average number of portions of fruit and vegetables that respondents reported consuming the previous day. In local authorities across Coastal West Sussex CCG, Chichester and Horsham have a higher proportion of respondents reporting that they had 5 or more portions of fruit and vegetables the previous day than in England.
The proportion of the population meeting the recommended 5-a-day (aged 16+): 2015
| Locality | %1 | 95% LCI | 95% UCI | Mean2 | 95% LCI | 95% UCI | Mean3 | 95% LCI | 95% UCI |
|---|---|---|---|---|---|---|---|---|---|
| Adur | 52.6 | 45.5 | 59.5 | 2.57 | 2.33 | 2.82 | 2.36 | 2.11 | 2.62 |
| Arun | 56.7 | 52.2 | 61.0 | 2.66 | 2.50 | 2.83 | 2.39 | 2.25 | 2.53 |
| Chichester | 67.1 | 62.1 | 71.8 | 2.78 | 2.60 | 2.96 | 2.62 | 2.45 | 2.80 |
| Horsham | 59.3 | 54.4 | 63.9 | 2.60 | 2.43 | 2.78 | 2.56 | 2.40 | 2.72 |
| Worthing | 50.1 | 44.7 | 55.5 | 2.45 | 2.26 | 2.65 | 2.29 | 2.12 | 2.46 |
| West Sussex | 57.4 | 55.5 | 59.3 | 2.58 | 2.52 | 2.65 | 2.44 | 2.38 | 2.50 |
| South East | 56.2 | 55.7 | 56.8 | 2.60 | 2.58 | 2.62 | 2.41 | 2.39 | 2.43 |
| England | 52.3 | 52.1 | 52.5 | 2.51 | 2.50 | 2.52 | 2.27 | 2.26 | 2.28 |