Mental Health
Ensuring good mental health within the population and throughout the life course is about more than the absence of a mental disorder.
Mental health is a major contributor to overall wellbeing and quality of life within the population and is related to many determinants such as social networks, physical health and educational attainment.
Mental illness covers a range of symptoms and experiences, which can bring distress and reduces the ability to cope with the demands of everyday life.
Enabling people to develop and maintain good mental health is critically important to a healthy, happy and productive population.
Further information on mental health can be found in Public Health England’s Health Profiles.
Prevalence of Mental Health Conditions and Disorders
This section examines the prevalence of mental health problems and conditions in Crawley CCG.
“Traditional” groupings (notably divided according to neurotic or psychotic symptoms) have been adopted. However, it is acknowledged that there is considerable debate relating to the categorisation of mental health problems and there are caveats on how well people fit into any one group or definition (comorbidity being quite common), as some people will experience both neurotic and psychotic symptoms.
Main Types of Mental Health Problems
- Common Mental Health Problems/”Neurotic” relates to symptoms which are regarded as extreme forms of ‘normal’ emotional experiences such as depression, anxiety or panic. These are more frequently referred to as “common mental health problems”
- Severe Mental Health Problems/”Psychotic” symptoms act to alter the perception of reality, symptoms may include hallucinations, delusions or paranoia, with the person seeing, hearing, smelling, feeling or believing things that no one else does
- Organic Mental Health Problems relate to conditions that are caused directly by brain damage or due to brain malfunction, the most common of these is dementia
Common Mental Health Disorders
The Adult Psychiatric Morbidity Survey (APMS 2007) provided estimates of the prevalence of common mental health conditions by age and gender. Common mental health conditions include mood and anxiety disorders (e.g. generalised anxiety disorder, major depressive disorder), and obsessive compulsive disorder (OCD).
The table below presents estimates of the number of people in Crawley CCG who have a common mental health problem. These are presented by age and gender. These figures have been calculated by applying the prevalence estimates from the APMS 2007 to the 2014 CCG population estimates devised by the ONS.
Note: As some people may have more than one mental health problem (comorbidity) the total does not equal the sum of all specific mental health problems. These estimates reflect the adult (16+) population, and do not include estimates of childhood mental health conditions.
Prevalence of common mental health disorders: Crawley CCG
| Men | 16-24 | 25-34 | 35-44 | 45-54 | 55-64 | 65-74 | 75+ | all |
|---|---|---|---|---|---|---|---|---|
| Mixed anxiety and depressive disorder | 460 | 670 | 630 | 620 | 370 | 140 | 110 | 2930 |
| Generalised anxiety disorder | 110 | 370 | 400 | 310 | 150 | 100 | 60 | 1440 |
| Depressive episode | 80 | 240 | 220 | 200 | 80 | 10 | 10 | 810 |
| All phobias | 20 | 130 | 130 | 50 | 30 | 10 | <5 | 340 |
| Obessive compulsive disorder | 90 | 130 | 100 | 50 | 20 | 10 | 10 | 380 |
| Panic disorder | 80 | 80 | 110 | 60 | 30 | 40 | 10 | 420 |
| Any CMD | 720 | 1310 | 1280 | 1110 | 580 | 260 | 170 | 5310 |
| Women | 16-24 | 25-34 | 35-44 | 45-54 | 55-64 | 65-74 | 75+ | all |
|---|---|---|---|---|---|---|---|---|
| Mixed anxiety and depressive disorder | 660 | 1330 | 790 | 1050 | 510 | 330 | 310 | 4840 |
| Generalised anxiety disorder | 280 | 410 | 480 | 590 | 310 | 140 | 120 | 2330 |
| Depressive episode | 160 | 160 | 260 | 360 | 120 | 60 | 90 | 1230 |
| All phobias | 140 | 230 | 220 | 160 | 120 | 20 | 10 | 880 |
| Obessive compulsive disorder | 160 | 140 | 80 | 120 | 40 | 20 | 20 | 570 |
| Panic disorder | 40 | 220 | 110 | 80 | 80 | <5 | 30 | 530 |
| Any CMD | 1190 | 2170 | 1580 | 1850 | 1000 | 510 | 520 | 8670 |
| All | 16-24 | 25-34 | 35-44 | 45-54 | 55-64 | 65-74 | 75+ | all |
|---|---|---|---|---|---|---|---|---|
| Mixed anxiety and depressive disorder | 1120 | 1990 | 1410 | 1680 | 890 | 470 | 420 | 7780 |
| Generalised anxiety disorder | 390 | 770 | 880 | 910 | 450 | 240 | 180 | 3810 |
| Depressive episode | 240 | 410 | 480 | 550 | 210 | 70 | 110 | 1990 |
| All phobias | 160 | 350 | 350 | 220 | 160 | 20 | 10 | 1210 |
| Obessive compulsive disorder | 250 | 280 | 180 | 160 | 60 | 20 | 30 | 950 |
| Panic disorder | 120 | 300 | 220 | 130 | 110 | 40 | 40 | 950 |
| Any CMD | 1910 | 3470 | 2880 | 2980 | 1560 | 780 | 700 | 14010 |
Personality Disorders
Personality disorders are conditions where an individuals’ personality characteristics can cause regular and long term problems in the way they cope with everyday life and interact with other people; anti-social personality disorder (ASPD) and borderline personality disorder (BPD) are two types.
APMS (2007) describes these disorders as:
“ASPD is characterised by disregard for and violation of the rights of others. People with ASPD have a pattern of aggressive and irresponsible behaviour which emerges in childhood or early adolescence. They account for a disproportionately large proportion of crime and violence committed. ASPD was present in 0.3% of adults aged 18 or over (0.6% of men and 0.1% of women).”
“BPD is characterised by high levels of personal and emotional instability associated with significant impairment. People with BPD have severe difficulties with sustaining relationships, and self-harm and suicidal behaviour is common.”
In Crawley CCG, approximately 290 adults aged 16-64 were estimated to have borderline personality disorder, and 220 with antisocial personality disorder.
Applying sex-specific prevalence rates of borderline personality disorder to the West Sussex population aged 16-64 years (by CCG)
| Disorder | % Males | % Females | % all | Coastal West Sussex CCG | Crawley CCG | Horsham and Mid Sussex CCG | West Sussex |
|---|---|---|---|---|---|---|---|
| Borderline Personality Disorder | 0.3% | 0.6% | 0.4% | 1,130 | 290 | 560 | 1,980 |
| Antisocial personality disorder | 0.6% | 0.1% | 0.3% | 850 | 220 | 420 | 1,480 |
The presence of a personality disorder, notably antisocial personality disorder, may have considerable implications in the treatment and management of co-existing psychiatric and physical conditions. Co-existence of a personality disorder and another mental health problem is high.
Prevalence of psychotic disorder in the past year
| 16-24 | 25-34 | 35-44 | 45-54 | 55-64 | 65-74 | 75+ | All | |
|---|---|---|---|---|---|---|---|---|
| Males | - | 0.6% | 0.7% | 0.1% | - | - | - | 0.3% |
| Females | 0.4% | 0.2% | 1.1% | 0.8% | 0.6% | - | - | 0.5% |
| Total | 0.2% | 0.4% | 0.9% | 0.5% | 0.3% | - | - | 0.4% |
Applying these assumptions to the West Sussex population means approximately 2,720 adults in West Sussex are estimated to have a psychotic disorder. Breaking these figures down to the CCG areas within the county:
- 1,630 people in the Coastal West Sussex CCG area
- 350 people in the Crawley CCG area
- 740 people in the Horsham and Mid Sussex CCG area
Prevalence is estimated as being significantly higher for black men (3.1%); no significant differences are estimated in women. Prevalence estimates also vary according to household income: from 0.1% of adults in the highest quintile to 0.9% of adults in the lowest quintile. This difference is noted as being more prominent among men than women.
Recorded Prevalence of Dementia, Depression and Severe Mental Illness
Caveats
- This is recorded prevalence and higher numbers may be related to improved identification
- Not everyone with a condition is identified and placed on the register, or present themselves to a GP
- Some people with conditions will not be registered with a GP.
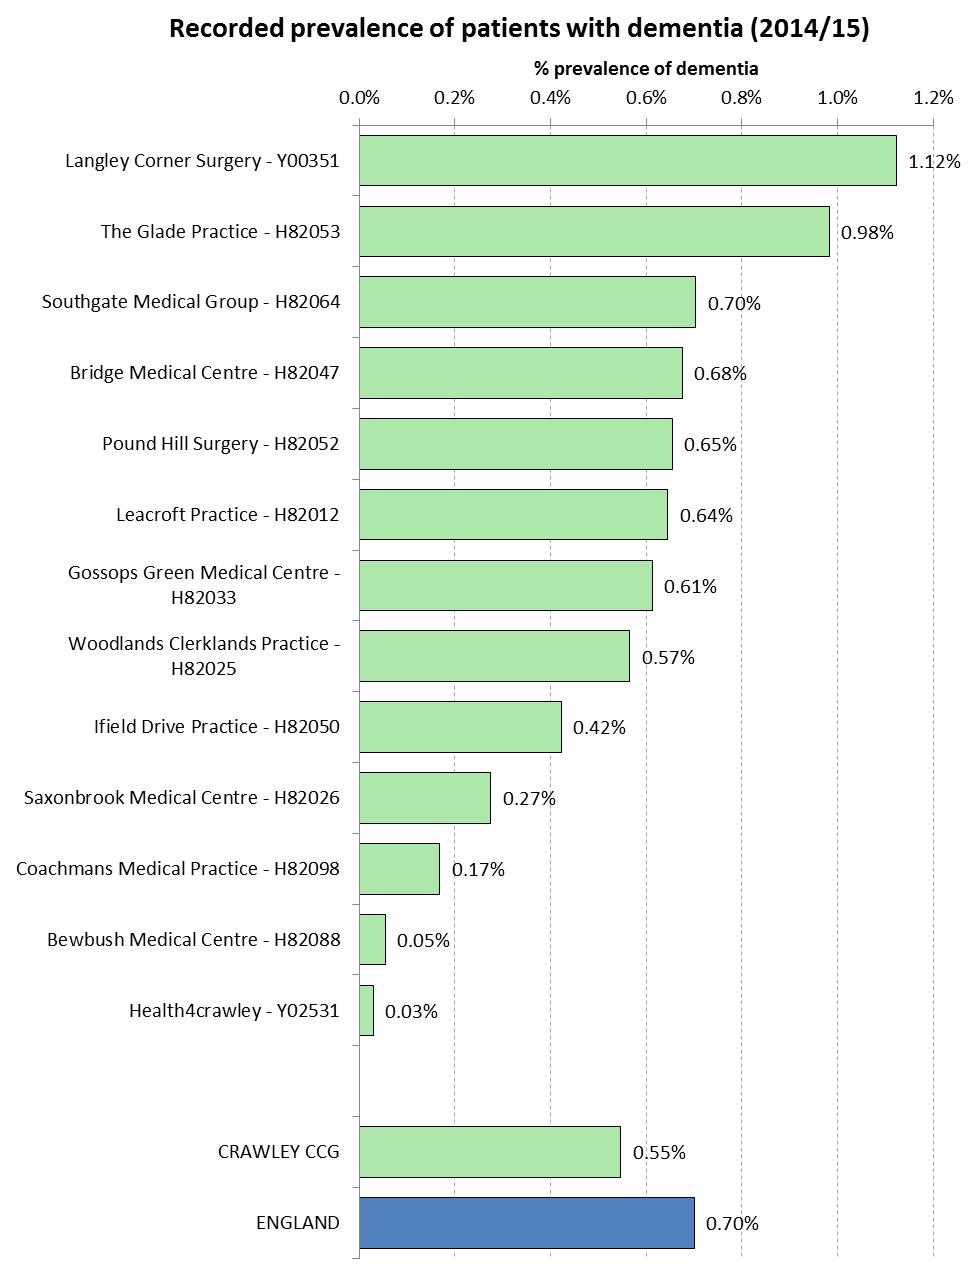
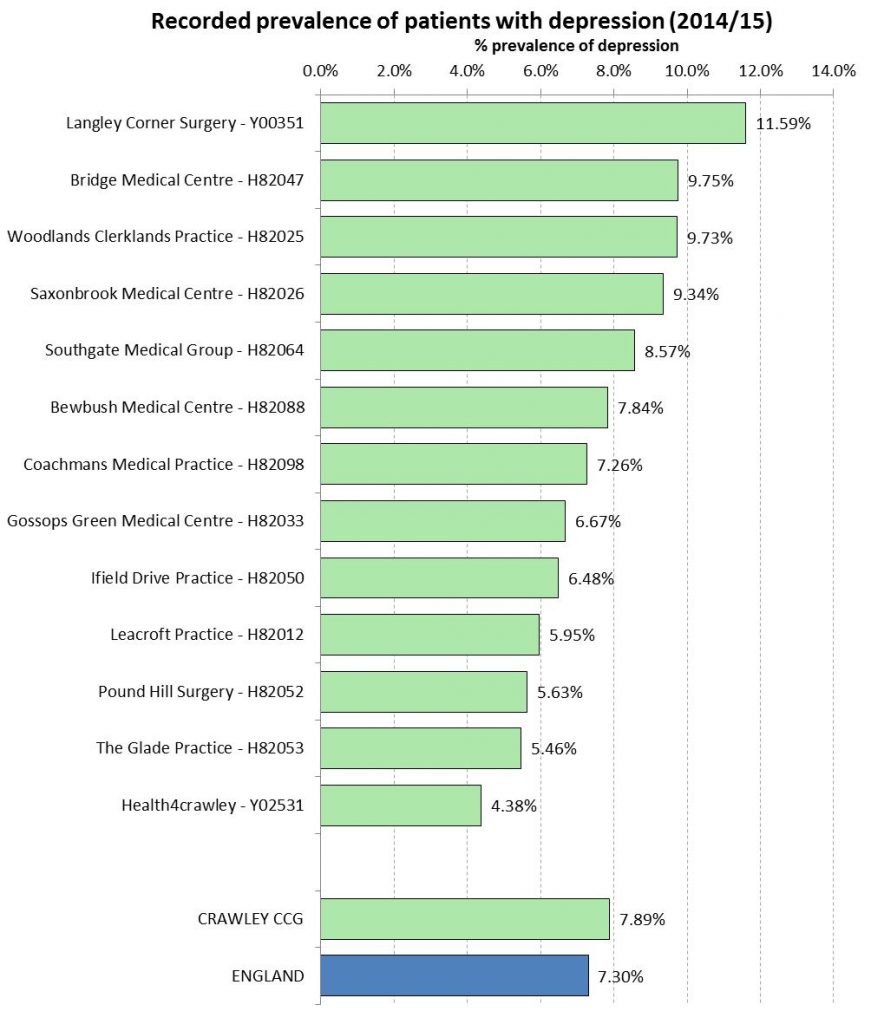
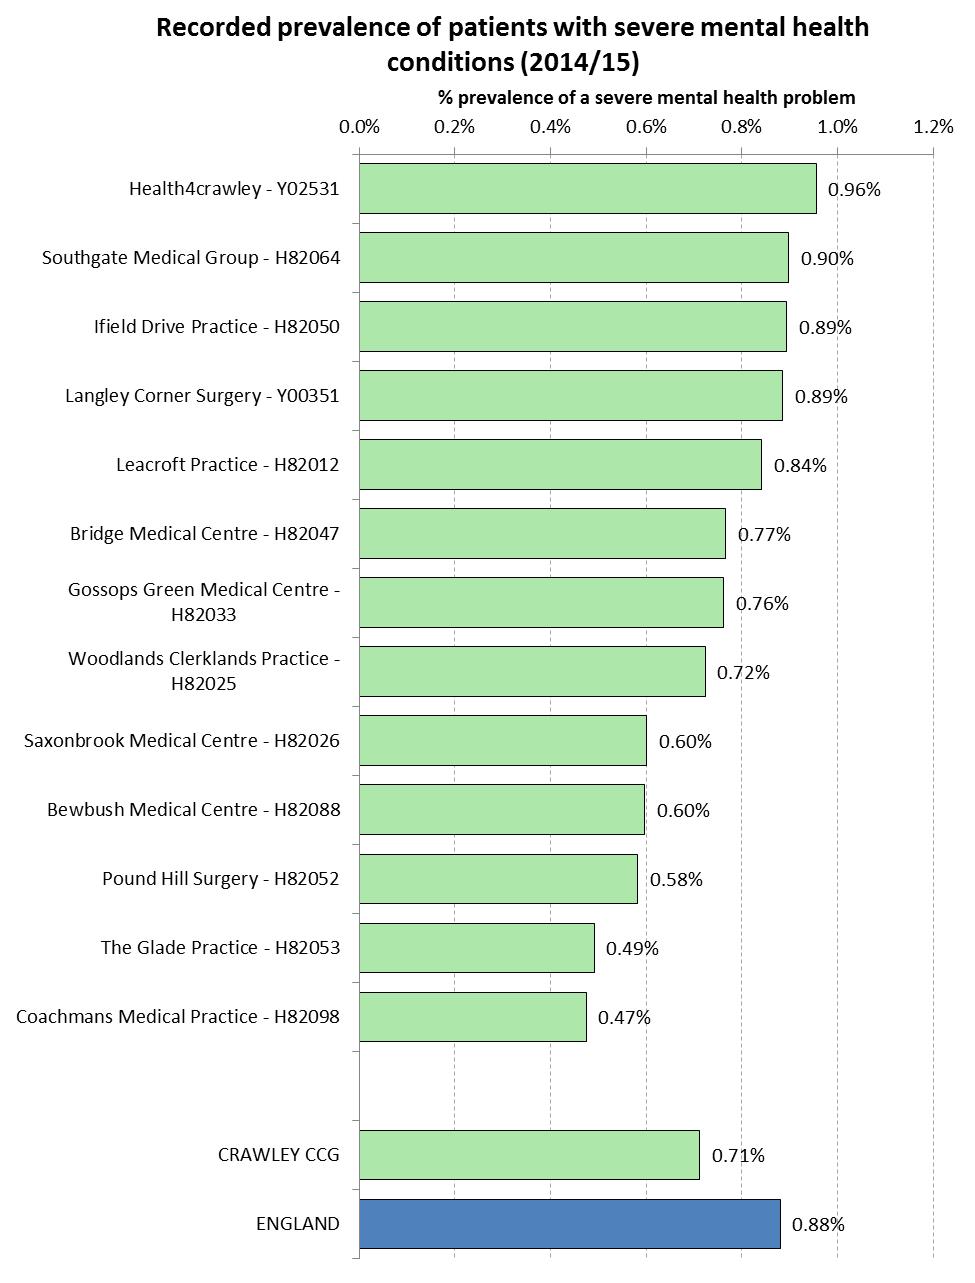
As part of the Quality and Outcomes Framework (QOF), GPs hold registers relating to dementia, depression and severe mental illness (schizophrenia, bipolar disorder and other psychoses). The following charts provide the percentage of patients who were recorded (in 2014/15) on these registers for each practice in the Crawley CCG region.
Recorded Prevalence of Patients Diagnosed with Dementia at Practice Level, for the Crawley CCG Region (2014/15)
Recorded Prevalence of Patients Diagnosed with Depression at Practice Level, for the Crawley CCG Region (2014/15)
Recorded Prevalence of Patients Diagnosed with Schizophrenia, Bipolar Affective Disorder and other Psychoses at Practice Level, for the Crawley CCG Region (2014/15)
Hospital Admissions for Self Harm
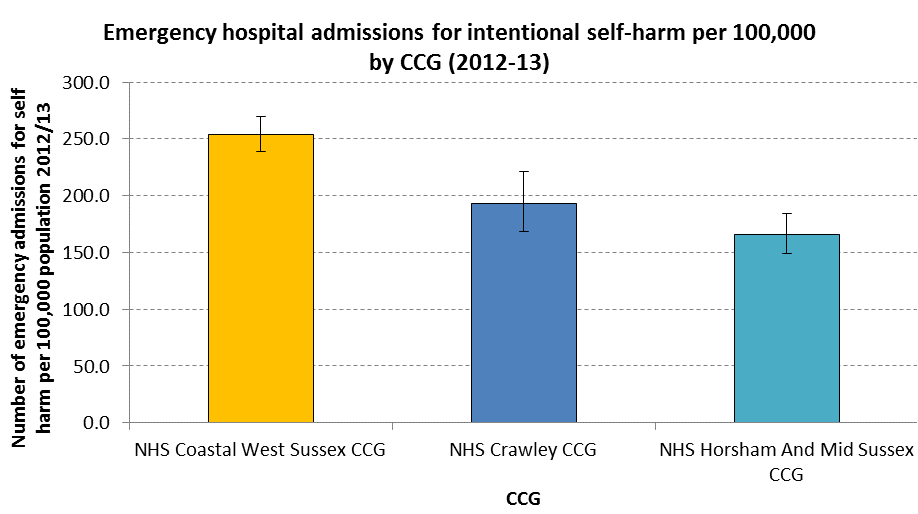
Another key underlying indicator of mental health is the rate of emergency hospital admissions for intentional self-harm. These Hospital Episode Statistics are provided by HSCIC. The latest data available are for 2012-13. Emergency hospital admissions for self-harm was significantly higher in Coastal West Sussex CCG, compared to Crawley CCG and Horsham and Mid Sussex CCG.
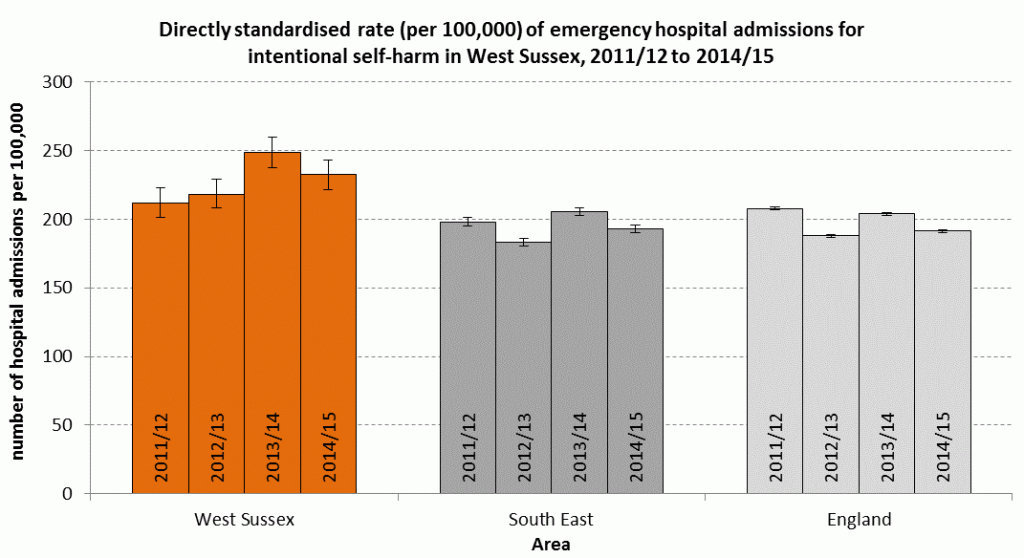
Public Health England also summarises data on admissions for self-harm by county. The number of admissions at local authority level are quite small and are therefore not presented. The graph below shows emergency hospital admissions for intentional self-harm in West Sussex, the South East and England. The directly standardised rate (per 100,000) of admissions due to intentional self-harm in West Sussex is higher than in the South East or England.
Suicide
Suicide is a significant cause of death in young adults and is used as an indicator of underlying rates of mental ill-health (Public Health England).
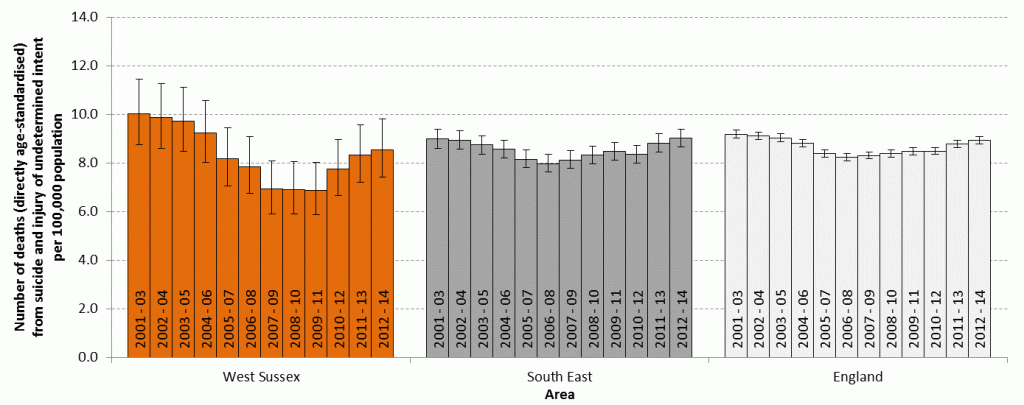
Public Health England provides age-standardised mortality statistics for this indicator and for the latest available data for CCG level (2010-2012) indicates that for Crawley CCG the mortality rate from suicide and injury of undetermined intent (100,000) is 11.8 (95% Confidence Interval (CI) = 8.2 to 16.4). The large confidence intervals for the rates indicate that there may be no difference across CCGs.
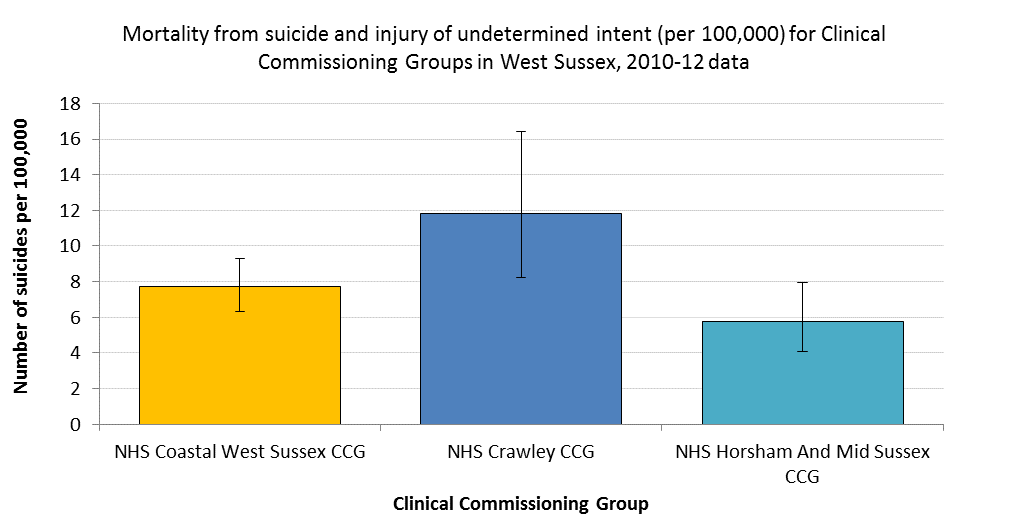
The data for this indicator are available at local authority (district) level. However, where the observed total number of deaths in a time period is less than 25, the rates are suppressed as there are too few deaths to calculate directly standardised rates reliably. As such, only data for West Sussex County are presented in the chart below (rates over time). The overlapping confidence intervals at county level, indicate that this chart should be interpreted with caution as there may be no differences across years.
