Tobacco
Smoking is the single greatest cause of preventable illness and premature death in the UK and is a major cause of health inequalities. The health impact of smoking extends beyond smokers, as there are many heath effects of second hand smoking (SHS). Further information about smoking can be found in the Local Tobacco Control Profiles for England produced by Public Health England.
Smoking Prevalence
This section includes data on prevalence of smoking among adults and across socio-economic groups.
Survey Data. Information relating to smoking rates is collected via the Integrated Household Survey (IHS). This is a composite survey combining questions asked in a number official social surveys including the Labour Force Survey, Life Opportunities Survey, and General Lifestyles Survey. Each of these surveys include a common core set and then individual survey-specific questions.
Since 2010, IHS data relating to smoking have been released at local authority level, although it should be noted that at a local level, the sample size from national surveys can be small, and this acts to increase the volatility of the rates estimated.
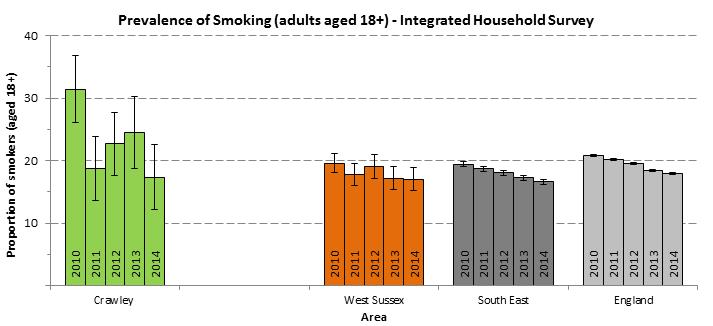
The graph shows the smoking prevalence in Crawley from the IHS. Overlapping confidence intervals suggest little difference in smoking prevalence between areas.
Number of Respondents to the IHS Survey (2010-2014)
| Area | 2010 | 2011 | 2012 | 2013 | 2014 |
|---|---|---|---|---|---|
| Crawley | 293 | 222 | 266 | 214 | 207 |
| West Sussex | 2,429 | 1,986 | 1,731 | 1,692 | 1,602 |
| South East | 36,302 | 32,035 | 30,334 | 30,922 | 29,677 |
| England | 252,936 | 210,671 | 193,172 | 195,772 | 185,17 |
Smoking among Routine and Manual Workers
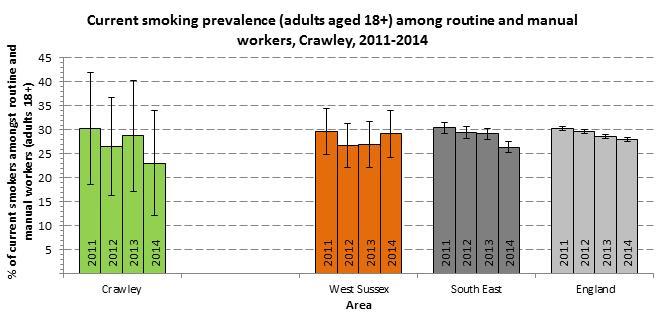
There remains a considerable difference in smoking rates between socio-economic groups. The graph below shows the smoking prevalence among routine and manual workers in Crawley from the Integrated Household Survey. Data for other occupation types are not currently available at sub-national levels.
Again, as the sample size at local authority level (see table below) is small, figures are quite volatile.
Number of Respondents (Routine and Manual) to the IHS Survey (2011-2014)
| Area | 2011 | 2012 | 2013 | 2014 |
|---|---|---|---|---|
| Crawley | 60 | 71 | 59 | 57 |
| West Sussex | 360 | 347 | 321 | 330 |
| South East | 6,018 | 5,983 | 5,898 | 5,649 |
| England | 45,345 | 43,400 | 42,987 | 41,042 |
Local Smoking Rates – Modelled Rates
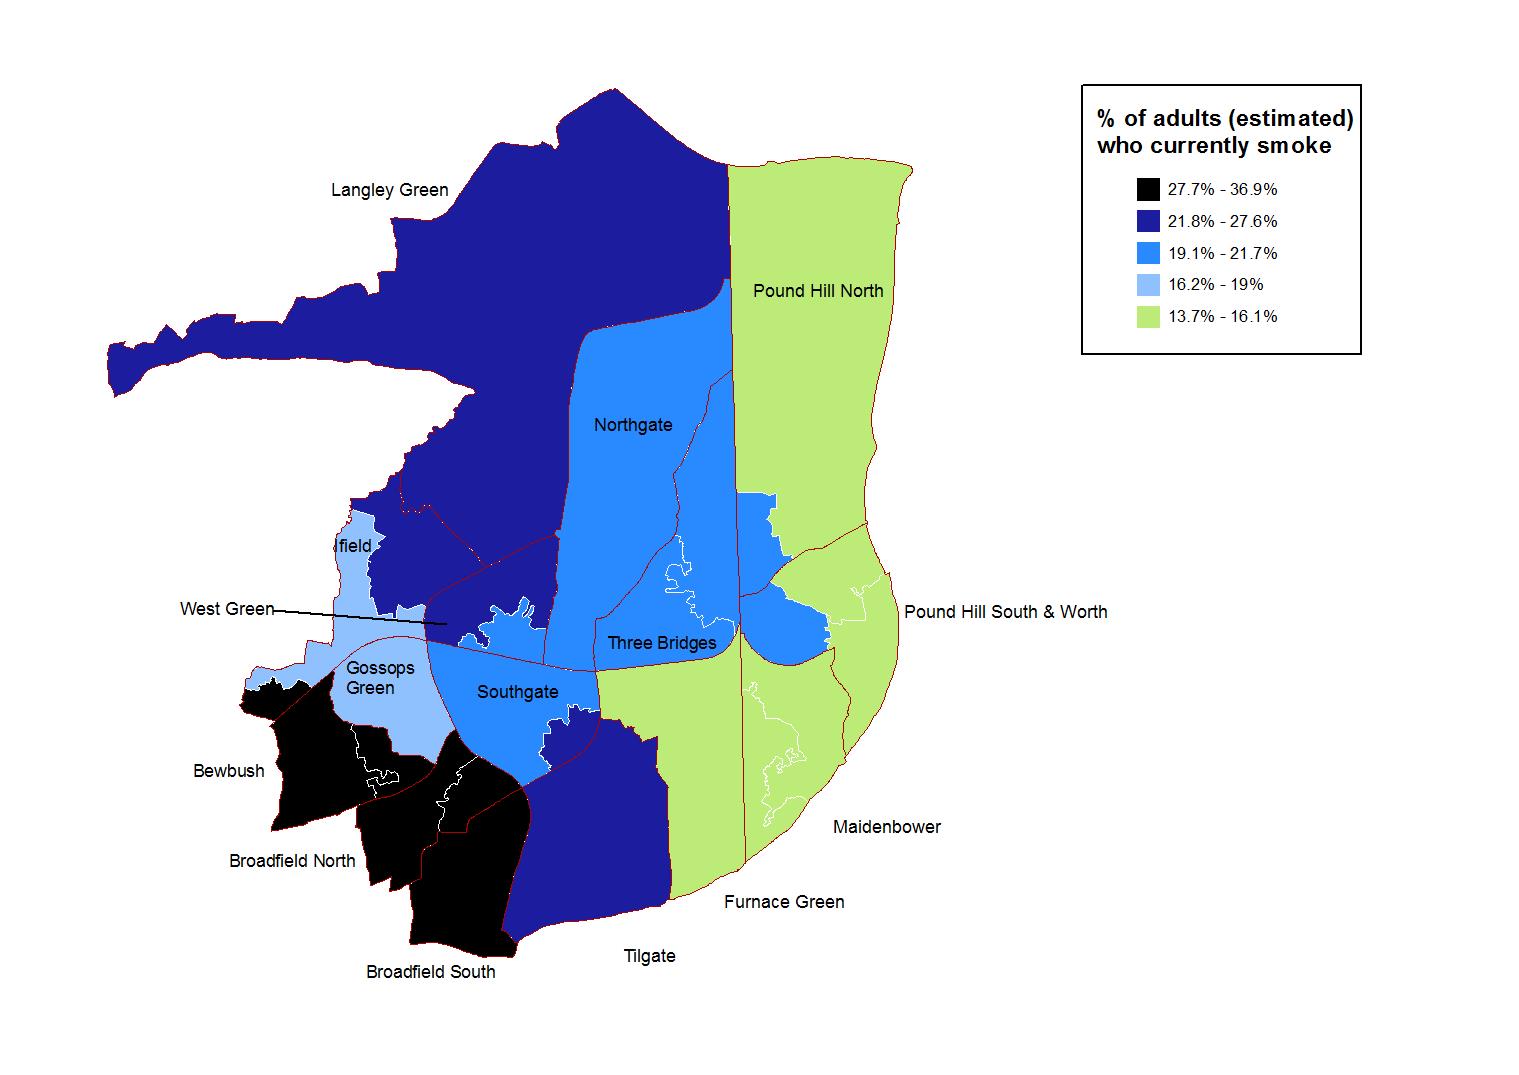
In addition to information from national surveys, smoking rates have been modelled at a small area level incorporating assumptions on smoking rates with other local area-level characteristics. Note. Synthetic estimates at a small area level should be treated with caution; they provide an indication of lifestyle behaviours at a small area level.
The area level (MSOA) characteristics associated with an increased propensity for an adult to be a current smoker were areas with:
- A high proportion of residents aged 16-74 in semi-routine occupations
- A larger index of multiple deprivation crime and disorder score
- A higher proportion of residents with a limiting long-term illness
- A higher proportion of adults diagnosed with lung cancer
- A higher proportion of the working age population claiming benefits for 12 months or more
- A higher proportion of lone parent with dependent children households
- A higher proportion of residents living in council tax band C
- A higher proportion of male residents; and a higher proportion of households with no car
The map below shows information modelled at middle super output area (MSOA) level. Data relate to the period 2006-2008 and for the 16+ population, not the 18+ population.
Smoking at Time of Delivery
Smoking in pregnancy increases the risk of low weight babies and premature birth, and children exposed to smoke in their homes are not only at greater risk of developing illnesses, including respiratory conditions, but are far more likely to become smokers themselves in later life.
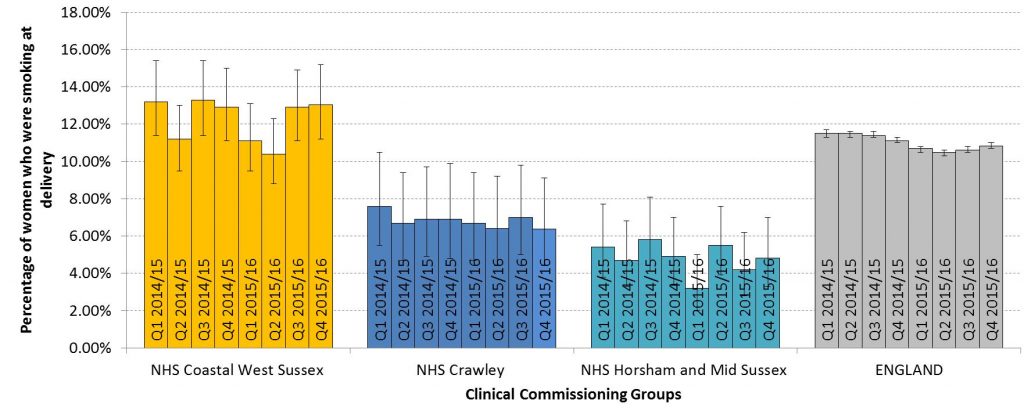
In Crawley CCG, 6.6% of new mothers reported smoking at time of delivery. This is lower than neighbouring Coastal West Sussex CCG, and higher than Horsham and Mid Sussex CCG. Nationally, 10.6% of women reported that they were smokers at the time of delivery; significantly higher than for Crawley CCG.
The number and proportion of women smoking at time of delivery (2015/16)
| Locality | Number of Maternities | Women Smoking at Time of Delivery (with percentage and 95% CI) | % of women whose smoking status was unknown |
|---|---|---|---|
| Coastal West Sussex CCG | 4,645 | 551, (11.9%, 95% CI: 11.0% - 12.8%) | 1.3% |
| Crawley CCG | 1,710 | 113, (6.6%, 95% CI: 5.5% - 7.9%) | 0.3% |
| Horsham and Mid Sussex CCG | 2,243 | 99, (4.4%, 95% CI: 3.6% - 5.3%) | 1.9% |
| NHS England South (South East) | 48,037 | 4,975, (10.4%, 95% CI: 10.1% - 10.6%) | 0.9% |
| South Commissioning Region | 149,406 | 15,263, (10.2%, 95% CI: 10.1% - 10.4%) | 1.3% |
| England | 631,225 | 67,195, (10.6%, 95% CI: 10.6% - 10.7%) | 3.1% |
Smoking Prevalence among Young People
This section includes data from the 'What about YOUth' Survey, the West Sussex Lifestyle Survey of 14 and 15 year olds, as well as modelled estimates of smoking at small geographies.
School Based Lifestyle Survey of 14/15 year olds (Year 10 pupils)
Most of the national prevalence rates and surveys which include smoking questions exclude children or young adults. The West Sussex Public Health and Social Research Unit, working with local authorities and participating schools, have undertaken lifestyle surveys of year 10 pupils. The last available survey was conducted in 2014; this included questions on smoking status and whether their parents or guardians smoked.
The 2014 survey found that across West Sussex, 14% (n = 493) of young people in year 10 reported either occasional or regular smoking. This is lower that the prevalence of occasional or regular smoking in 2010 (23.8%, n = 809). The table below gives a breakdown of smoking categories by gender for the 2010 and 2014 survey years. The table illustrates that the proportion of never smokers has increased and the proportion of ex-smokers as well as occasional and regular smokers has decreased.
Lifestyle Survey (2010)
| 2010 | Number of Girls | Number of Boys | Total1 | % of Girls Answering | % of Boys Answering | Total1 |
|---|---|---|---|---|---|---|
| Never | 1,119 | 1,224 | 2,353 | 65.5% | 73.1% | 69.3% |
| Given up | 129 | 103 | 232 | 7.6% | 6.2% | 6.8% |
| Occasionally | 287 | 216 | 503 | 16.8% | 12.9% | 14.8% |
| Regularly | 173 | 131 | 306 | 10.1% | 7.8% | 9.0% |
| Total | 1,708 | 1,674 | 3,394 | - | - | - |
Lifestyle Survey (2014)
| 2014 | Number of Girls | Number of Boys | Total1 | % of Girls Answering | % of Boys Answering | Total1 |
|---|---|---|---|---|---|---|
| Never | 1,554 | 1,287 | 2,867 | 80.4% | 83.0% | 81.1% |
| Given up | 88 | 77 | 173 | 4.6% | 5.0% | 4.9% |
| Occasionally | 189 | 108 | 307 | 9.8% | 7.0% | 8.7% |
| Regularly | 102 | 77 | 186 | 5.0% | 5.0% | 5.3% |
| Total | 1,933 | 1,549 | 3,533 | - | - | - |
Smoking behaviours in young people: what about YOUth Survey
In addition to local surveys, the What About YOUth? (WAY) Survey is a new national study which aims to examine the health behaviours of young people across England. The study asked thousands of 15 year olds questions about subjects such as health, diet, exercise, bulling, alcohol, drugs and smoking. Data from the survey is currently available at county level.
15 year olds were identified as current smokers if they responded:
- “I sometimes smoke cigarettes now but I don’t smoke as many as one a week”
- “I usually smoke between one and six cigarettes per week”
- “I usually smoke more than six cigarettes a week”
In the 2014/15 WAY survey, 10.6% of 15 year olds who responded to the survey in West Sussex were identified as “current smokers”. This was significantly higher than the proportion of 15 year olds who were current smokers in England (8.2%). In addition, 7.1% of 15 year olds in West Sussex were regular smokers; smoking one or more cigarettes per week. The proportion was again higher in West Sussex (7.1%) than in England (5.5%).
Further information about the WAY survey can be found on the HSCIC website.
Modelled synthetic estimates of smoking status for young people aged 11-15 and 16-17
In January 2015, synthetic estimates were produced to model smoking among young people at a local level using data from the Understanding Society survey (pooled data for years 2009-2012). These were produced because prevalence statistics are not routinely available at small geographical area levels.
The data presented below relates to estimates for never smokers, not current smokers (including never smokers and those who have tried smoking once or twice only), occasional smokers (occasional smoking is defined as smoking sometimes but not every week) and regular smokers (regular smoking is defined as smoking at least one cigarette every week).
Note. these are synthetic estimates developed to investigate the simultaneous influence of individual and area characteristics on smoking outcomes. Results reflect estimated prevalence based on socio-demographic profiles of geographical areas. They may not reflect actual smoking prevalence.
Furthermore, the Understanding Society survey on which these estimates are based uses specific criteria for defining an ‘occasional smoker’ and a ‘regular smoker’ which may not match that of other surveys such as the Smoking Drinking and Drug Use survey. The table shows that there are large confidence intervals for these estimates and as such any interpretation should be treated with caution.
Modelled Prevalence of Smoking among Young People in the Crawley CCG Region
| Estimated Prevalence | 11-15 year olds (with 95% CI) | 16-17 year olds (with 95% CI) |
|---|---|---|
| Never smokers | 89.2% (78.9 to 97.0%) | 77.3% (55.3 to 92.2%) |
| Never smoked or tried smoking once or twice only | 95.6% (87.3 to 99.5%) | 80.7% (49.0% to 96.4%) |
| Occasional smokers | 1.5% (0.2 to 3.4%) | 5.9% (1.3 to 17.1%) |
| Regular smokers | 2.8% (0.5 to 6.5%) | 13.6% (3.8 to 31.5%) |
Smoking Attributable Mortality
This section presents the smoking attributable mortality rate (directly-age standardised) for adults over 35 years.
Tobacco smoking has been attributed to a host of communicable (e.g. tuberculosis and lower respiratory infections) as well as non-communicable (e.g. malignant neoplasms of the trachea, bronchus, and lung, ischaemic heart disease, and chronic obstructive pulmonary disease) diseases (WHO 2012. Global Report: Mortality Attributable to Tobacco). Smoking attributable mortality is an estimate of the number of deaths attributable to cigarette smoking.
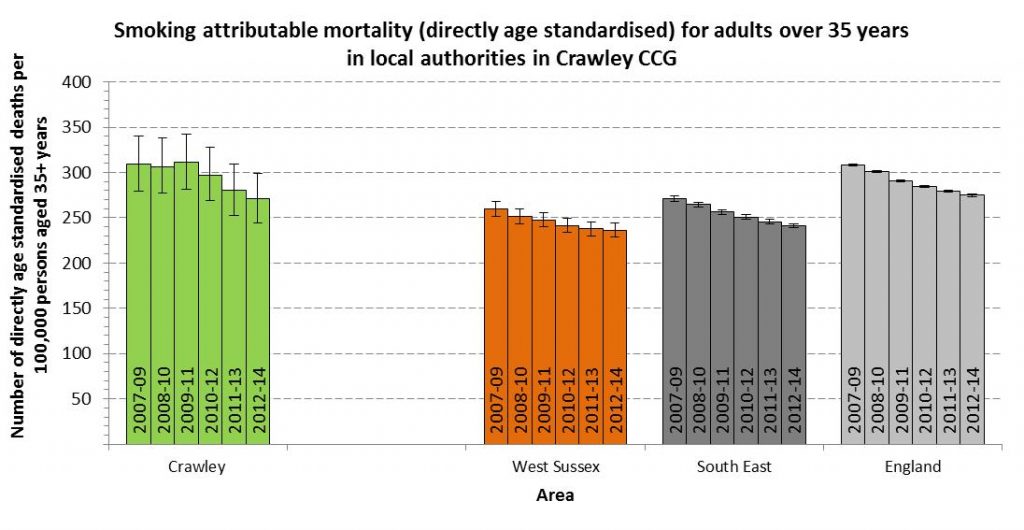
Smoking attributable mortality presented here is the directly age-standardised rate (per 100,000) for persons aged 35+ years. The graph below shows smoking attributable mortality rates for Crawley for 2007-09 to 2012-2014.
The overlapping confidence intervals indicate that there may be little difference across years.
