Population Mortality
In 2014, there were 1,989 deaths among individuals living in NHS Horsham and Mid Sussex CCG (HSCIC, 2015).
This page contains information on underlying cause of death in Horsham and Mid Sussex CCG, life expectancy (at Local Authority level), as well as premature (under 75s) mortality, including infant and child mortality statistics (at Local Authority level).
Underlying cause of death
This section shows the cause of death data for NHS Horsham and Mid Sussex CCG in 2014.
The Primary Care Mortality Database (PCMD) holds records of the underlying cause for each death. This is based on an international classification of diseases (the International Statistical Classification of Diseases and Related Health Problems 10th Revision, ICD-10, World Health Organization, 2016) which identifies the medical condition judged to be the underlying cause of death. Underlying cause of death can be defined as the disease or injury which initiated the train of morbid events leading directly to death or the circumstances of the accident or violence which produced the fatal injury.
The underlying cause may be a long-standing, chronic disease or disorder that predisposed the patient to later fatal complications. The diagram below shows the underlying cause of death for deaths registered in 2014 in the NHS Horsham and Mid Sussex CCG area. The size of each bubble represents the relative number of deaths.
In 2014, the biggest underlying cause of death was cancer (558 deaths, 28% of all deaths in the CCG). The second biggest underlying cause of death in 2014 for NHS Horsham and Mid Sussex CCG were diseases of the circulatory system with 524 deaths registered in the CCG being attributed to this disease group.
Life Expectancy
Period expectation of life at a given age for an area, in a given time period, is an estimate of the average number of years a person of that age would survive if they experienced the particular area’s age specific mortality rates for that period throughout the rest of their life (ONS, 2015). The figure reflects mortality among those living in the area in each time period, rather than the mortality among those born in each area. It is not therefore the number of years a person in the area in each time period could actually expect to live, both because the death rates are likely to change in the future and because many of those within the area may live elsewhere for at least part of their lives.
Period life expectancy at birth is not a guide to the remaining expectation of life at any given age. For example, if female life expectancy at birth was 80 years for a particular area, the life expectancy of women aged 65 years in that area is likely to exceed 15 years. This reflects the fact survival from a particular age depends only on the death rates beyond that age, whereas survival from birth is based on death rates at every age. Life expectancy at birth and life expectancy at age 65 are currently available at the Local Authority district level rather than at Clinical Commissioning Group level from ONS.
Life Expectancy at birth
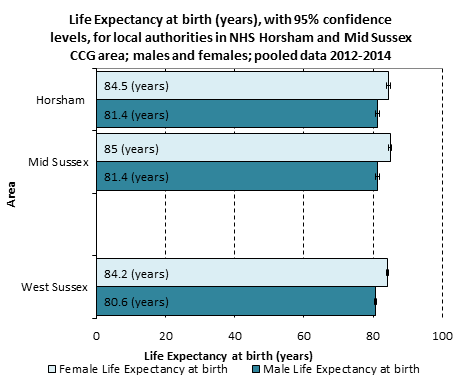
The latest data, for 2012-2014, shows that life expectancy at birth is lowest for males (81.4 years) compared to females (84.5 years) in Horsham, with a gap of over three years between men and women. Life expectancy at birth in Mid Sussex is lowest for males (81.4 years) compared to females (85 years), with a gap of three and a half years between men and women.The gap follows the pattern for the county (80.6 years for males in West Sussex and 84.2 years for females). The figure below shows the gap in Life Expectancy at birth between men and women for Horsham and Mid Sussex Local Authority Districts.
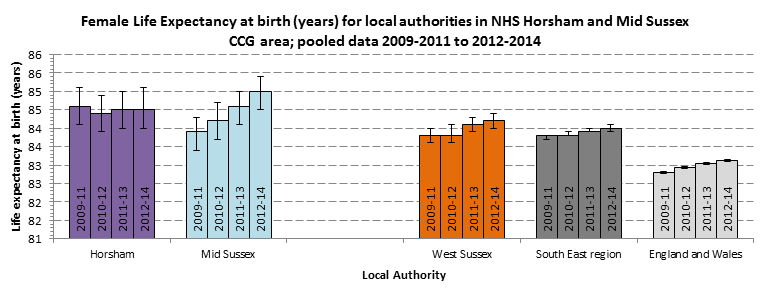
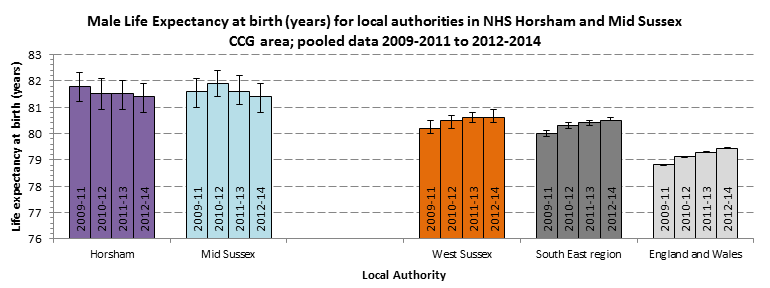
Life Expectancy at birth has increased nationally in recent years as it has in West Sussex and some of its constituent Districts, although due to the smaller number of deaths at these geographies, confidence limits around the estimates are larger and overlap. The figures below show the Life Expectancy at birth for females and for males in Horsham, Mid Sussex, West Sussex County, South East region and England.
Life Expectancy at age 65
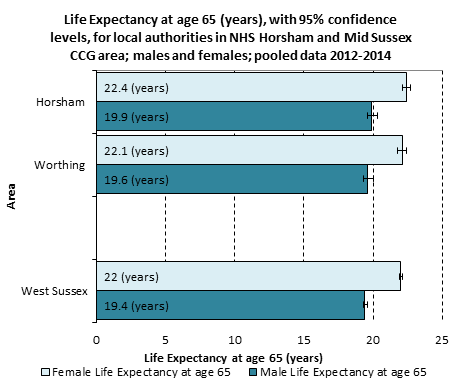
The 2012-2014 data shows that life expectancy at age 65, as it was for life expectancy at birth, is lowest for males (19.9 years) compared to females (22.4 years) in Horsham and lowest for males (19.4 years) compared to females (22.1 years) in Mid Sussex. The figure below shows the gap in Life Expectancy at age 65 for men and women in Horsham and Mid Sussex and West Sussex.
Life Expectancy at age 65 has also increased nationally in recent years as it has in West Sussex and some of its constituent Districts. Again, due to the smaller number of deaths at these geographies, confidence limits around the estimates are larger and overlap, indicating that there may be no statistically significant difference over time. The tables below show the Life Expectancy at age 65 for females and for males in Local Authority Districts of NHS Horsham and Mid Sussex CCG.
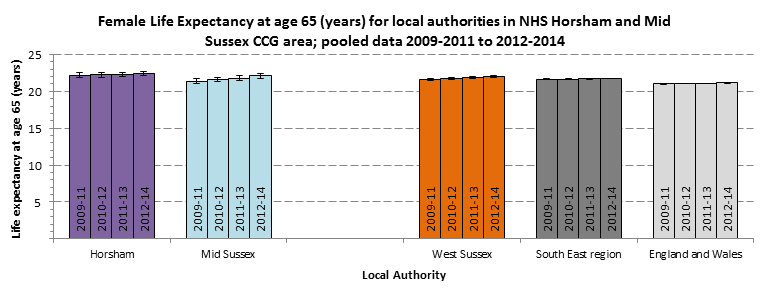
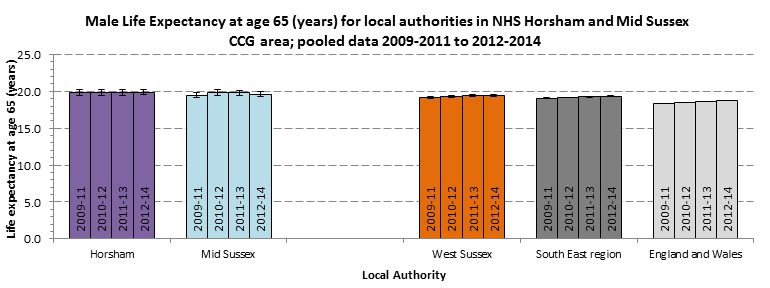
Small Area Life Expectancy at birth
Life Expectancy for small areas is calculated using mortality data aggregated over a number of years to ensure sufficient numbers of deaths are recorded. The most recent data for Life Expectancy at birth at CCG level is for the period 2010-2012. During this period, the Life Expectancy at birth in NHS Crawley CCG for males was 81.6 years (95% CI: 81.1 – 82 years) and for females it was 84.1 years (95% CI: 83.7 – 84.5 years). The Life Expectancy in NHS Horsham and Mid Sussex CCG is significantly higher than England for the period 2010-12 (England males at birth; 79.2 years, 95% CI: 79.2 – 79.2 years, England females at birth; 83 years, 95% CI: 83 – 83 years).
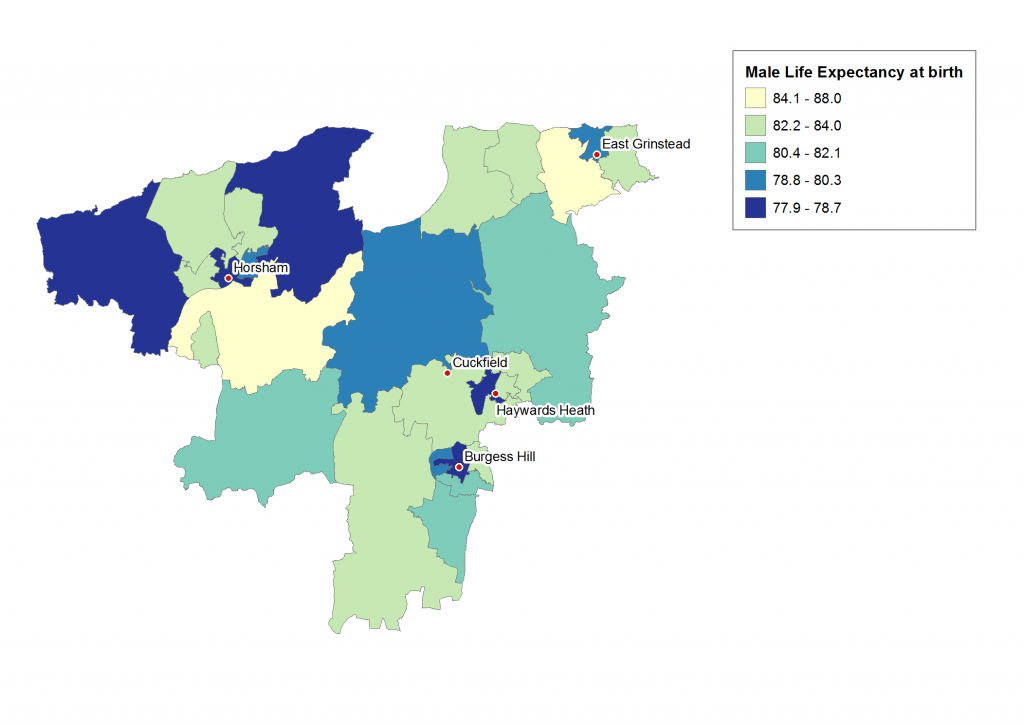
Life Expectancy at an even smaller level (Middle layer Super Output Areas (MSOA)) is available for the period 2009 to 2013. In West Sussex, the male Life Expectancy at birth for 2009 to 2013 (small area based) was 80.4 years and for females it was 84.0 years.
In NHS Horsham and Mid Sussex CCG, there is over a decade difference (10.1 years) in the Life Expectancy at birth for males between the highest and lowest Life Expectancy at MSOA level. The map below shows the variation in Life Expectancy at birth for males in MSOAs of NHS Horsham and Mid Sussex CCG for 2009 to 2013. The lowest Life Expectancy at birth for males was 77.9 years (95% CI: 76.1 – 79.7 years) in MSOA Horsham 001 (E02006588), which is located north of Horsham. The highest Life Expectancy at birth for males was 88 years (95% CI: 86 – 90 years) in MSOA Mid Sussex 004 (E02006607) which is near East Grinstead.
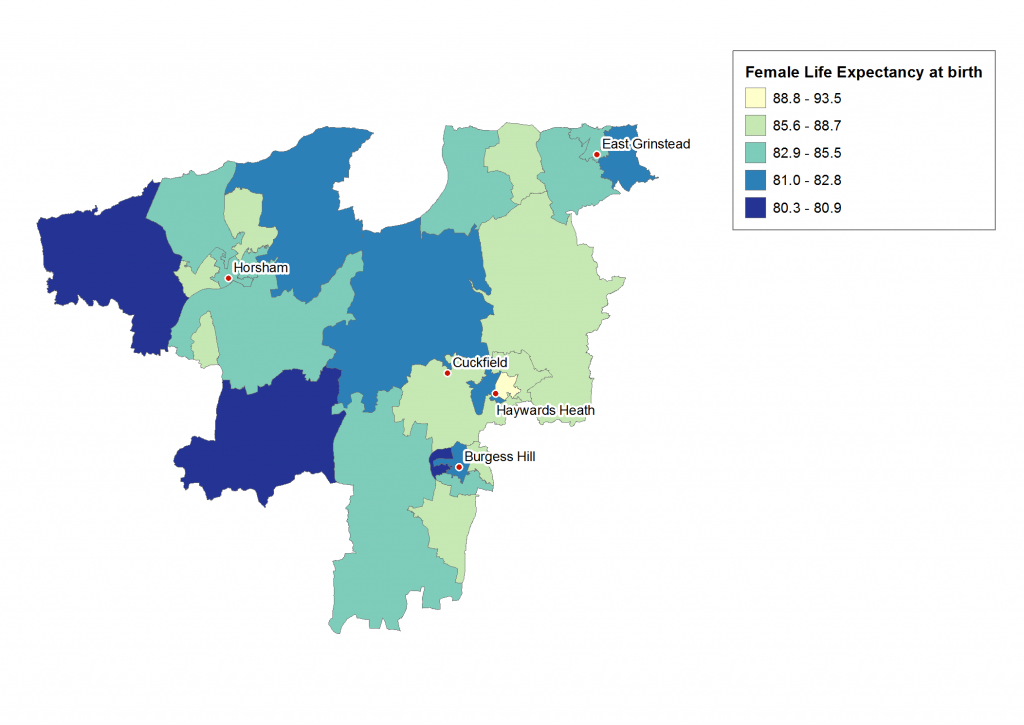
For females in NHS Horsham and Mid Sussex CCG, there is a gap of 13.2 years between the MSOA with the lowest and highest Life Expectancy at birth for females. The map below shows the variation in Life Expectancy at birth for females in MSOAs of NHS Horsham and Mid Sussex CCG for 2009 to 2013. The lowest Life Expectancy at birth for females was 80.3 years (95% CI: 78.2 – 82.4 years) which is in MSOA Horsham 011 (E02006598) located south of Horsham. The highest Life Expectancy at birth for females was 93.5 years (95% CI: 91.3 – 95.7 years), in MSOA Mid Sussex 010 (E02006613), near Haywards Heath.
Premature mortality
In England, in 2012-14, one in three people died before the age of 75. Deaths before this age are considered to be premature. Longer Lives is a web tool from Public Health England (available here) to higher premature mortality across Local Authority districts and counties in England. Data are drawn from records of deaths reported each year by the Office for National Statistics and are available in the Public Health Outcomes Framework (PHOF).
Premature mortality data in the Longer Lives tool are given as directly standardised rates per 100,000 (using the European Standard Population, ESP 2013) to enable comparisons across areas which have dissimilar population age structures. Standardising takes into account that death rates are higher in older populations. Data are pooled across three year periods to ensure that there are a sufficient number of deaths in each area to enable robust calculation of rates
The chart below shows the directly age-standardised rate of premature mortality (under 75s deaths per 100,000 ESP 2013) in Horsham and Mid Sussex Local Authority districts for years 2011-13 and 2012-14.
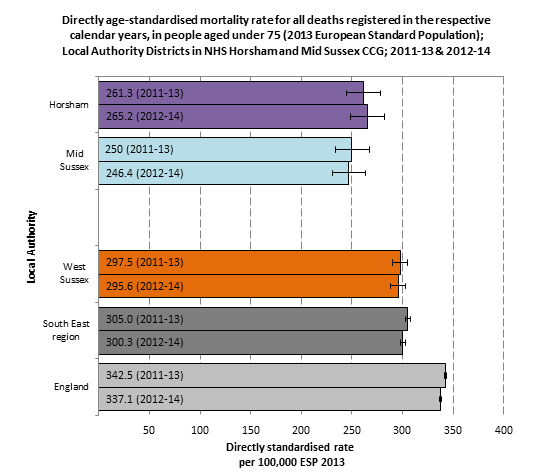
In Horsham and Mid Sussex districts combined, 1,917 deaths were recorded among those aged under 75 years in 2012-14. The standardised rate of 265.2 deaths per 100,000 ESP 2013 (95% CI: 248.8 – 282.3 deaths) in 2012-14 for Horsham meant that it was 50th out of 324 Local Authority Districts nationally when ranked in order of lowest to highest premature mortality rate. Mid Sussex premature mortality rate (246.4 deaths per 100,000 ESP 2013, 95% CI: 230.6 – 262.9 deaths) in 2012-14 for meant that it was 12th out of 324 Local Authority districts nationally when ranked in order of lowest to highest premature mortality rate. The premature mortality rates in both Horsham and Mid Sussex districts were significantly lower than the rate for West Sussex (295.6 deaths per 100,000 ESP 2013, 95% CI: 288.5 – 302.8 deaths), South East region (300.3 deaths per 100,000 ESP 2013, 95% CI: 298 – 302.6 deaths) and England rate for the 2012-14 (337.1 deaths per 100,000 ESP, 95% CI: 336.1 – 338.1).
Infant mortality
The infant mortality rate is expressed as the number of deaths of infants aged under 1 year per 1,000 live births. Nationally, the latest infant mortality data available (using pooled data from January 2012 to December 2014) shows that there were 4 deaths per 1,000 live births to infants in the first year of life. In West Sussex, during the same period, there were 3.4 deaths per 1,000 live births and this is statistically similar to the England rate.
In 2012-14 there were 28 deaths among infants under the age of 1 who were resident in Horsham and Mid Sussex districts. The trend in infant mortality rate for Horsham and for Mid Sussex between 2008-10 and 2012-14 are given in the chart below. The number of deaths at district level are generally very small and as such, estimates are accompanied by large confidence intervals indicating that there may be little or no change over time. In 2012-14, the directly age-standardised rate or infant mortality in Horsham was 3.7 deaths per 1,000 live births (95% CI: 2.0 – 6.2 deaths), which is not significantly different to West Sussex, the South East region, or England. In Mid Sussex, the directly age-standardised rate of infant mortality was 3.1 deaths per 1,000 live births (95% CI: 1.7 – 5.1 deaths) which again is statistically similar to West Sussex, region, and national figures.
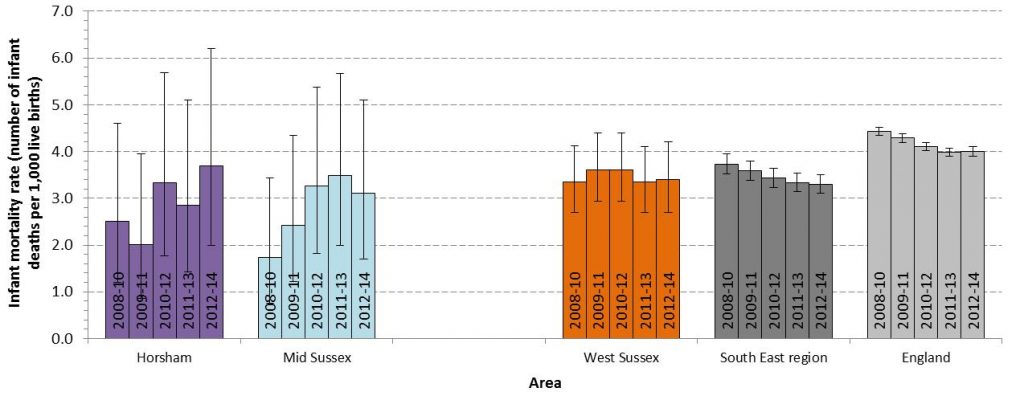
Infant mortality has only recently been published at the CCG level and so it is not possible yet to explore differences over time. However, for the pooled year 2012-2014, the crude infant mortality rate in NHS Horsham and Mid Sussex CCG was 3.7 deaths per 1,000 live births (95% CI: 2.4 – 5.4 deaths per 1,000). This is not significantly different from NHS Coastal West Sussex CCG (3.5 deaths per 1,000 live births, 95% CI: 2.6 – 4.6), NHS Crawley CCG (2.6 deaths per 1,000 live births, 95% CI: 1.4 – 4.5 deaths) or England (4 deaths per 1,000 live births, 95% CI: 3.9 – 4.1 deaths).
Child Mortality
After the age of one year, injury is the most common cause of death in young people; and many of these injuries are potentially avoidable. At CCG level child mortality statistics include the number of deaths to those aged 1 year to 17 years per 100,000 European Standard Population (2013 ESP). Data is currently only available for the period 2012-14 and this indicates that there were 12 deaths among children aged 1 year to 17 years in NHS Horsham and Mid Sussex CCG at a rate of 8.2 deaths per 100,000 ESP 2013 (95% CI: 4.2 – 14.3 deaths). This was not significantly different to the rate for NHS Coastal West Sussex CCG (8.9 deaths per 100,000 ESP 2013, 95% CI: 5.7 – 13.4), NHS Crawley CCG (5.3 deaths per 100,000 ESP 2013, 95% CI: 1.4 – 13.6 deaths) or England (12 deaths per 100,000 ESP 2013, 95% CI: 11.6 – 12.3 deaths). The small number of deaths, as reflected in the large confidence intervals, indicate that the estimates of mortality are highly variable.